

Question: This is balance sheet and below is the income statement Lehman Hospital Income Statement For Year Ended December 31, 2015 Revenues $96,000,000 Expenses 94,000,000 Net
This is balance sheet and below is the income statement
| Lehman Hospital | |
| Income Statement | |
| For Year Ended December 31, 2015 | |
| Revenues | $96,000,000 |
| Expenses | 94,000,000 |
| Net Income | $2,000,000 |
Using the data from your balance sheet and the following income statement answer the following questions (5 points each).
| Formula | |
| Calculation | |
| Answer |
Compute the total profit margin ratio for 2015. Is this good if the industry average is 2.5 percent?
Compute the return on assets ratio for 2015. Is this good if the industry average is 8.3%?
| Formula | See appendix B (attached) or text (p. 406) for formula |
| Calculation | |
| Answer |
Note: To find total assets (in profit margin formula) to compare to the industry average, the total assets average must be calculated for both years, therefore (2015 assets+2014 assets)/2 = total assets.
Compute the return on equity ratio for 2015. Is this good if the industry average is 5 percent?
| Formula | See appendix B (attached) or text (p. 406) for formula |
| Calculation | |
| Answer |
Note: To find total equity (in return on equity formula) to compare to the industry average, the total equity average must be calculated for both years, therefore (2015 equity+2014 equity)/2 = total equity.
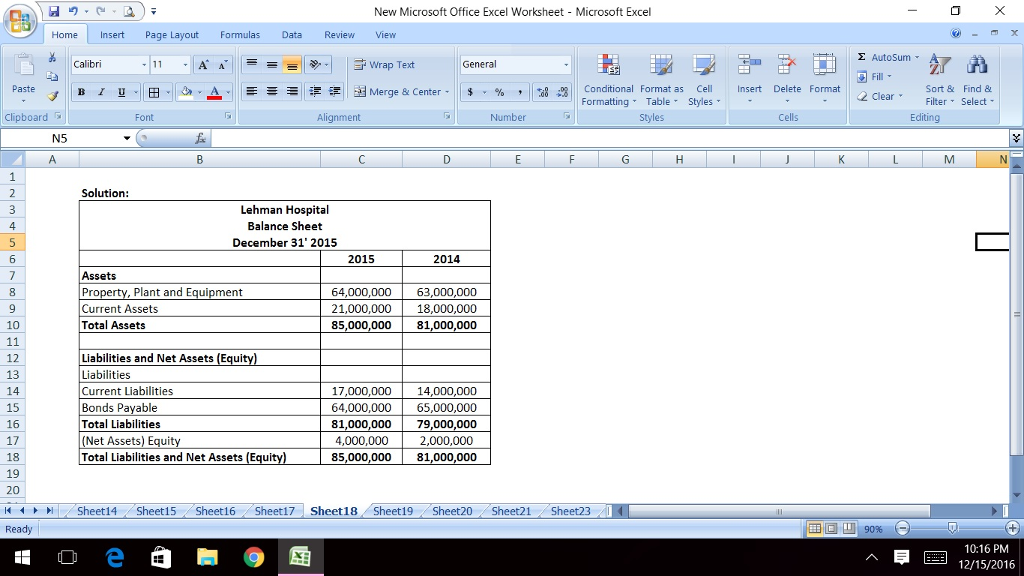
New Microsoft Office Excel Worksheet Microsoft Excel Insert page Layout Formulas Data Review view Home E AutoSum Wrap Text General Fill B I U EH A E E is EE Merge & Center v og Conditional Format as Cell Insert Delete Format Sort & Find & Formatting Table Styles 2 clear v Filter Select Paste Clipboard Numbe Cells Editing Fon gnment Styles Solution: Lehman Hospital Balance Sheet December 31 2015 2015 2014 Assets Property, Plant and Equipment 64,000,000 63,000,000 Current Assets 21,000,000 18,000,000 Total Assets 10 85,000,000 81,000,000 11 Liabilities and Net Assets (Equity) 12 13 Liabilities Current Liabilities 17,000,000 14,000,000 15 Bonds Payable 64,000,000 65,000,000 Total Liabilities 81,000,000 79,000,000 16 (Net Assets) Equity 4,000,000 17 2,000,000 Total Liabilities and Net Assets (Equity) 18 85,000,000 81,000,000 19 20 K 4 Sheet 14 Sheet 15 Sheet 16 Sheet17 Sheet 18 Sheet 19 Sheet 20 Sheet 21 sheet23 Ready 10:16 PM 12/15/2016
Step by Step Solution
There are 3 Steps involved in it

Get step-by-step solutions from verified subject matter experts