

Question: This is chapter simple linear regression. Can you explain how to determine the relationship between two variables ?How to sketch a scatter plof based the
This is chapter simple linear regression. Can you explain how to determine the relationship between two variables ?How to sketch a scatter plof based the data given ?How to find the equation of the least suares line that woll enable to predict a students's grade based on his or her study hour?And hour to find the coefficient of determination and coefficient of correlation?
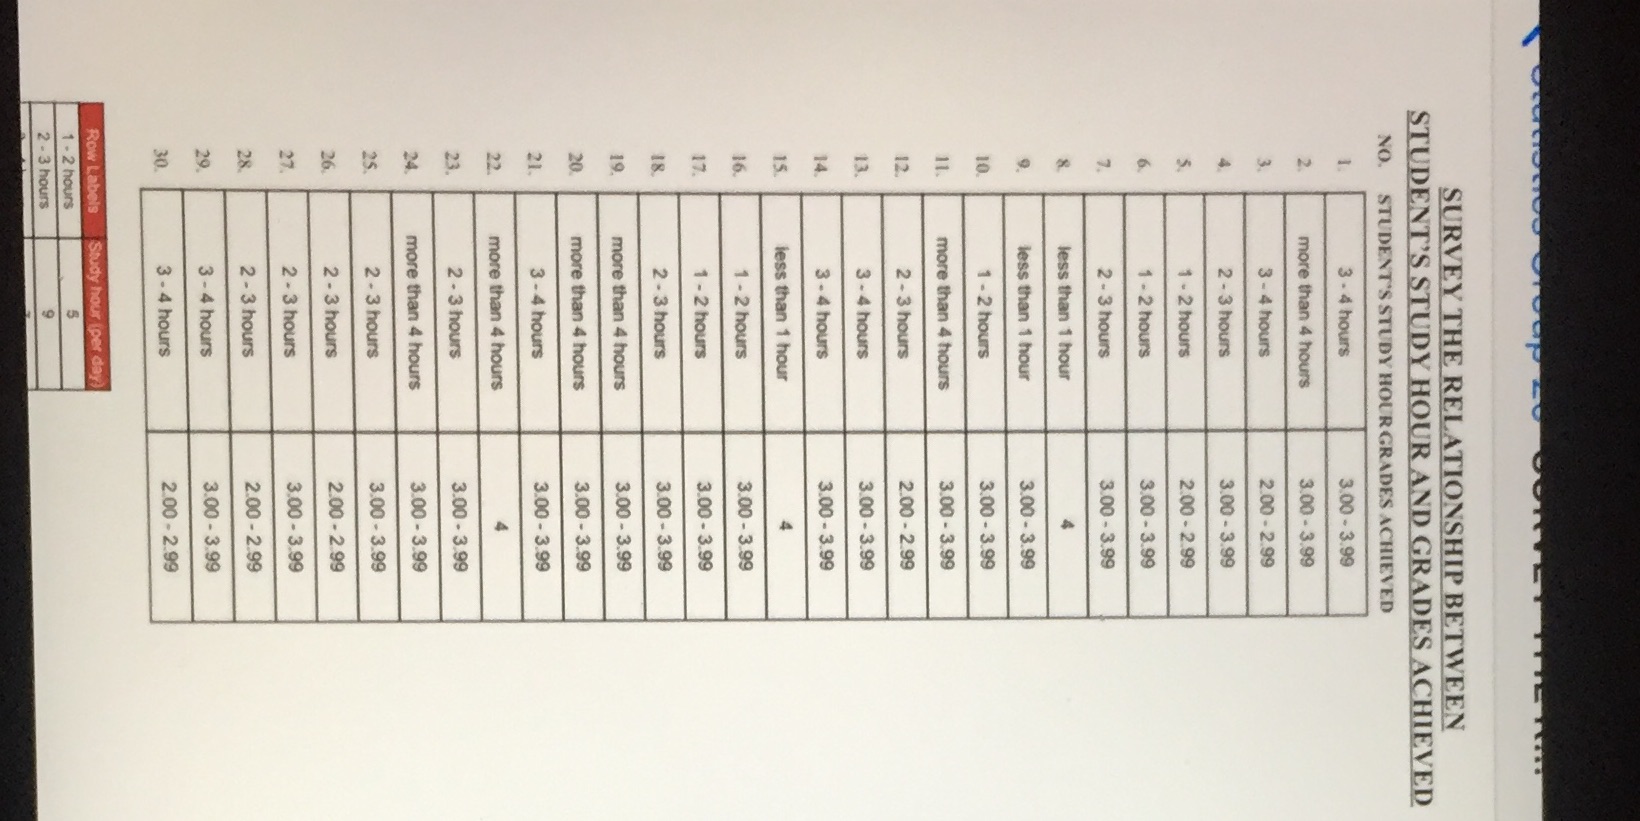
SURVEY THE RELATIONSHIP BETWEEN STUDENT'S STUDY HOUR AND GRADES ACHIEVED NO. STUDENT'S STUDY HOUR GRADES ACHIEVED 3 - 4 hours 3.00 - 3.99 more than 4 hours 3.00 - 3.99 3 - 4 hours 2.00 - 2.99 2 - 3 hours 3.00 - 3.99 1 - 2 hours 2:00 - 2.99 1 - 2 hours 3.00 - 3.99 2 - 3 hours 3.00 - 3.99 less than 1 hour less than 1 hour 3.00 - 3.99 1 - 2 hours 3.00 - 3.99 more than 4 hours 3.00 - 3.99 2 - 3 hours 2.00 - 2.99 3 - 4 hours 3.00 - 3.99 3 - 4 hours 3.00 - 3.99 less than 1 hour 1 - 2 hours 3.00 - 3.99 1 - 2 hours 3.00 - 3.99 2 - 3 hours 3.00 - 3.99 more than 4 hours 3.00 - 3.99 more than 4 hours 3.00 - 3.99 3 - 4 hours 3.00 - 3.99 more than 4 hours 2 - 3 hours 3.00 - 3.99 more than 4 hours 3.00 - 3.99 2 - 3 hours 3.00 - 3.99 2 - 3 hours 2.00 - 2.99 2 - 3 hours 3.00 - 3.99 2 - 3 hours 2.00 - 2.99 3 - 4 hours 3.00 - 3.99 3 - 4 hours 2.00 - 2.99 Row Labels Study hour (per day) 1 - 2 hours 2 - 3 hours
Step by Step Solution
There are 3 Steps involved in it

Get step-by-step solutions from verified subject matter experts