

Question: This is excel work READ THE ENTIRE PROBLEM BEFORE BEGINNING TO DEVELOP THE SPREADSHEET. Producing correct spreadsheets that implement the specifications in the assignment is,
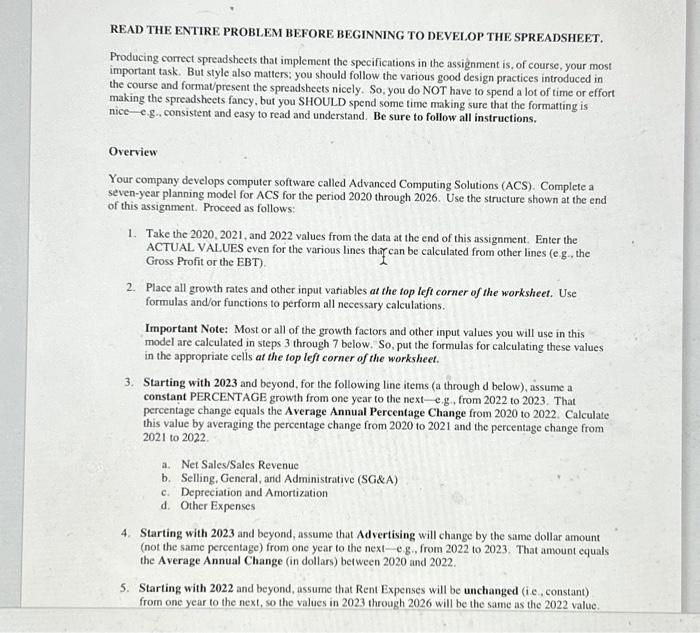
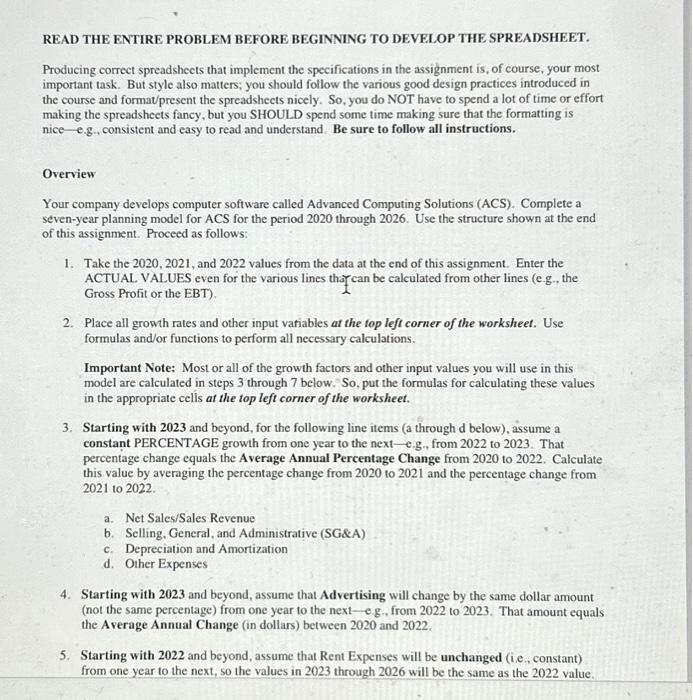
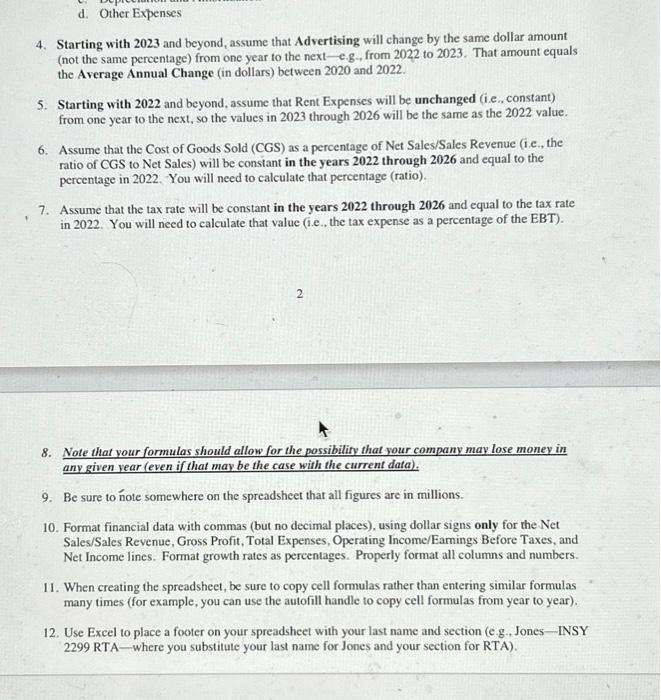
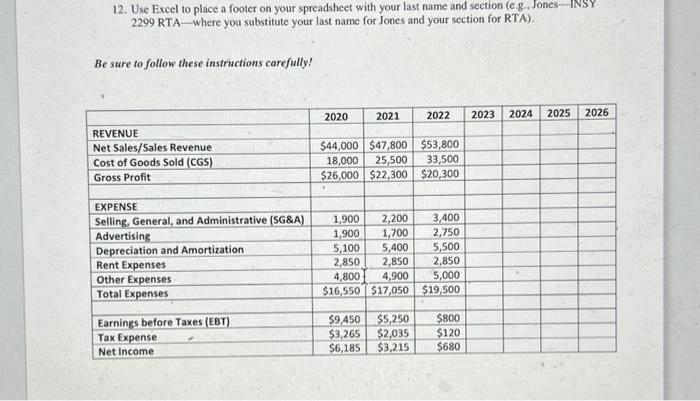
READ THE ENTIRE PROBLEM BEFORE BEGINNING TO DEVELOP THE SPREADSHEET. Producing correct spreadsheets that implement the specifications in the assignment is, of course, your most important task. But style also matters; you should follow the various good design practices introduced in the course and format/present the spreadsheets nicely. So, you do NOT have to spend a lot of time or effort making the spreadsheets fancy, but you SHOULD spend some time making sure that the formatting is nice- g., consistent and easy to read and understand. Be sure to follow all instructions. Overview Your company develops computer software called Advanced Computing Solutions (ACS). Complete a seven-year planning model for ACS for the period 2020 through 2026. Use the structure shown at the end of this assignment. Proceed as follows: 1. Take the 2020,2021 , and 2022 values from the data at the end of this assignment. Enter the ACTUAL VALUES even for the various lines tha can be calculated from other lines (e.g., the Gross Profit or the EBT). 2. Place all growth rates and other input vatiables at the top left corner of the worksheet. Use formulas and/or functions to perform all necessary calculations. Important Note: Most or all of the growth factors and other input values you will use in this model are calculated in steps 3 through 7 below. So, put the formulas for calculating these values in the appropriate cells at the top lefi corner of the worksheet. 3. Starting with 2023 and beyond, for the following line items (a through d below), assume a constant PERCENTAGE growth from one year to the next-e,g, from 2022 to 2023 . That percentage change equals the Average Annual Percentage Change from 2020 to 2022 . Calculate this value by averaging the percentage change from 2020 to 2021 and the percentage change from 2021 to 2022. a. Net Sales/Sales Revenue b. Selling, General, and Administrative (SG\&A) c. Depreciation and Amortization d. Other Expenses 4. Starting with 2023 and beyond, assume that Advertising will change by the same dollar amount (not the same percentage) from one year to the next-e.g., from 2022 to 2023 . That amount equals the Average Annual Change (in dollars) between 2020 and 2022. 5. Starting with 2022 and beyond, assume that Rent Expenses will be unchanged (i.e, constant) from one year to the next, so the values in 2023 through 2026 will be the same as the 2022 value. READ THE ENTIRE PROBLEM BEFORE BEGINNING TO DEVELOP THE SPREADSHEET. Producing correct spreadsheets that implement the specifications in the assignment is, of course, your most important task. But style also matters; you should follow the various good design practices introduced in the course and format/present the spreadsheets nicely. So, you do NOT have to spend a lot of time or effort making the spreadsheets fancy, but you SHOULD spend some time making sure that the formatting is nice- e.g., consistent and easy to read and understand. Be sure to follow all instructions. Overview Your company develops computer software called Advanced Computing Solutions (ACS). Complete a seven-year planning model for ACS for the period 2020 through 2026. Use the structure shown at the end of this assignment. Proceed as follows: 1. Take the 2020,2021 , and 2022 values from the data at the end of this assignment. Enter the ACTUAL VALUES even for the various lines tha can be calculated from other lines (e.g., the Gross Profit or the EBT) 2. Place all growth rates and other input vatiables at the top left corner of the worksheet. Use formulas and/or functions to perform all necessary calculations. Important Note: Most or all of the growth factors and other input values you will use in this model are calculated in steps 3 through 7 below. So, put the formulas for calculating these values in the appropriate cells at the top left corner of the worksheet. 3. Starting with 2023 and beyond, for the following line items (a through d below), assume a constant PERCENTAGE growth from one year to the next- e.g., from 2022 to 2023 . That percentage change equals the Average Annual Percentage Change from 2020 to 2022. Calculate this value by averaging the percentage change from 2020 to 2021 and the percentage change from 2021 to 2022. a. Net Sales/Sales Revenue b. Selling, General, and Administrative (SG\&A) c. Depreciation and Amortization d. Other Expenses 4. Starting with 2023 and beyond, assume that Advertising will change by the same dollar amount (not the same percentage) from one year to the next-eg., from 2022 to 2023 . That amount equals the Average Annual Change (in dollars) between 2020 and 2022. 5. Starting with 2022 and beyond, assume that Rent Expenses will be unchanged (i.e., constant) from one year to the next, so the values in 2023 through 2026 will be the same as the 2022 value. 4. Starting with 2023 and beyond, assume that Advertising will change by the same dollar amount (not the same percentage) from one year to the next-e.g., from 2022 to 2023 . That amount equals the Average Annual Change (in dollars) between 2020 and 2022. 5. Starting with 2022 and beyond, assume that Rent Expenses will be unchanged (i.e., constant) from one year to the next, so the values in 2023 through 2026 will be the same as the 2022 value. 6. Assume that the Cost of Goods Sold (CGS) as a percentage of Net Sales/Sales Revenue (i.e., the ratio of CGS to Net Sales) will be constant in the years 2022 through 2026 and equal to the percentage in 2022 . You will need to calculate that percentage (ratio). 7. Assume that the tax rate will be constant in the years 2022 through 2026 and equal to the tax rate in 2022 . You will need to calculate that value (i.e., the tax expense as a percentage of the EBT). 2 8. Note that your formulas should allow for the possibility that your company mav lose money in any given year (even if that may be the case with the current data). 9. Be sure to note somewhere on the spreadsheet that all figures are in millions. 10. Format financial data with commas (but no decimal places), using dollar signs only for the Net Sales/Sales Revenue, Gross Profit, Total Expenses, Operating Income/Eamings Before Taxes, and Net Income lines. Format growth rates as percentages. Properly format all columns and numbers. 11. When creating the spreadsheet, be sure to copy cell formulas rather than entering similar formulas many times (for example, you can use the autofill handle to copy cell formulas from year to year). 12. Use Excel to place a footer on your spreadsheet with your last name and section (e.g., Jones-INSY 2299 RTA - where you substitute your last name for Jones and your section for RTA). 12. Use Excel to place a footer on your spreadsheet with your last name and section (e g. Jones2299 RTA - where you substitute your last name for Jones and your section for RTA). Be sure to follow these instructions carefully
Step by Step Solution
There are 3 Steps involved in it

Get step-by-step solutions from verified subject matter experts