

Question: this is for a practice worksheet The estimated percent distribution of a certain country's population for 2025 is shown in the accompanying pie chart. Find
this is for a practice worksheet
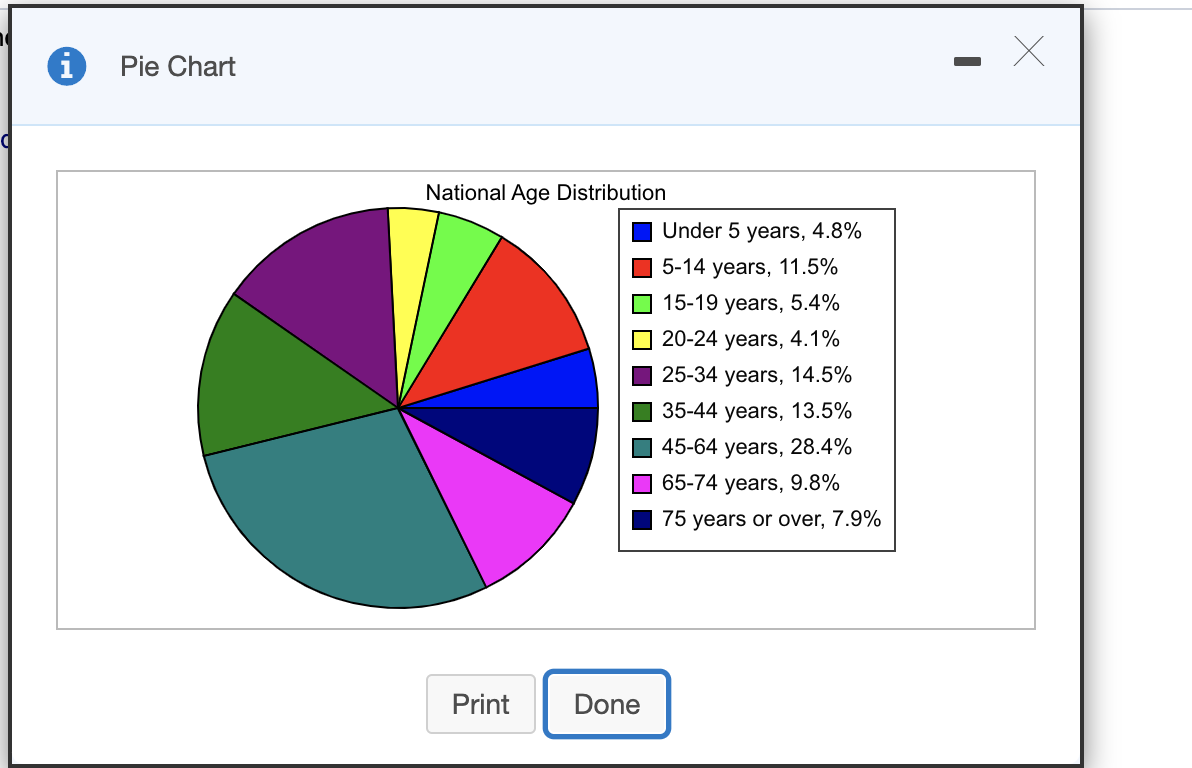
The estimated percent distribution of a certain country's population for 2025 is shown in the accompanying pie chart. Find the probability of each event listed in parts (a) through (d) below. [5 Click the icon to view the pie chart. (a) Randomly selecting someone who is under 5 years old The probability is :|%. (Round to one decimal place as needed.) o Pie Chart National Age Distribution I Under 5 years, 4.8% I 5-14 years, 11.5% |:| 15-19 years, 5.4% |:| 20-24 years, 4.1% I 25-34 years, 14.5% I 35-44 years, 13.5% I 45-64 years, 28.4% I 65-74 years, 9.8% I 75 years or over. 7.9%
Step by Step Solution
There are 3 Steps involved in it
1 Expert Approved Answer
Step: 1 Unlock

Question Has Been Solved by an Expert!
Get step-by-step solutions from verified subject matter experts
Step: 2 Unlock
Step: 3 Unlock