

Question: this is for biostatsistics: chi square, one factor ANOVA, two factor ANOVA, regression and correlation, and odds and risk ratio. 2) Chronic wasting disease (CWD)
this is for biostatsistics: chi square, one factor ANOVA, two factor ANOVA, regression and correlation, and odds and risk ratio.
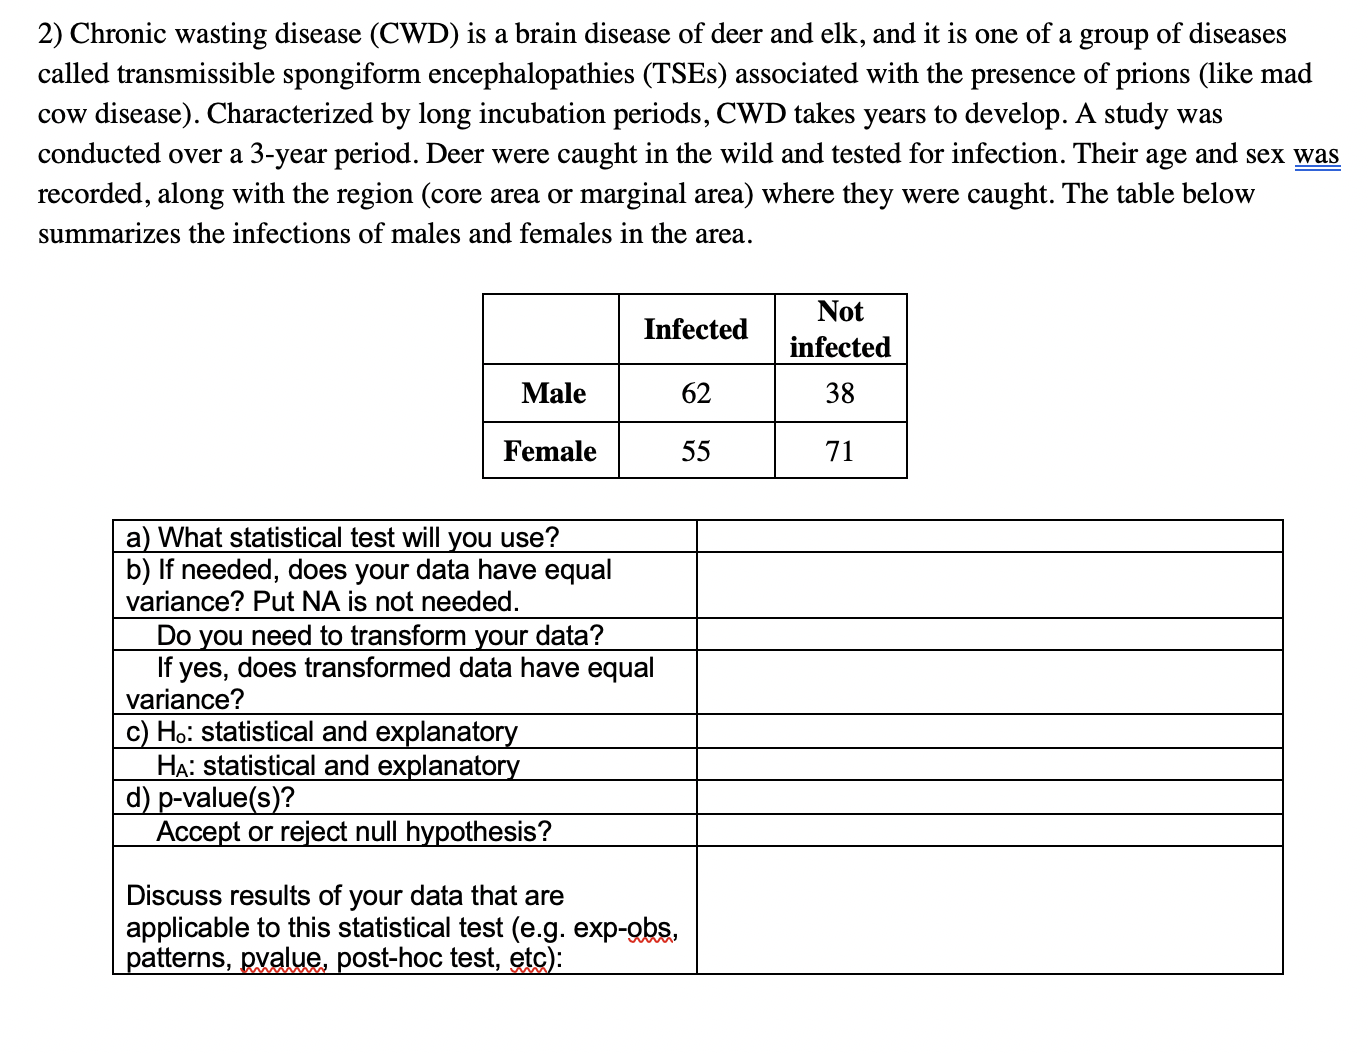
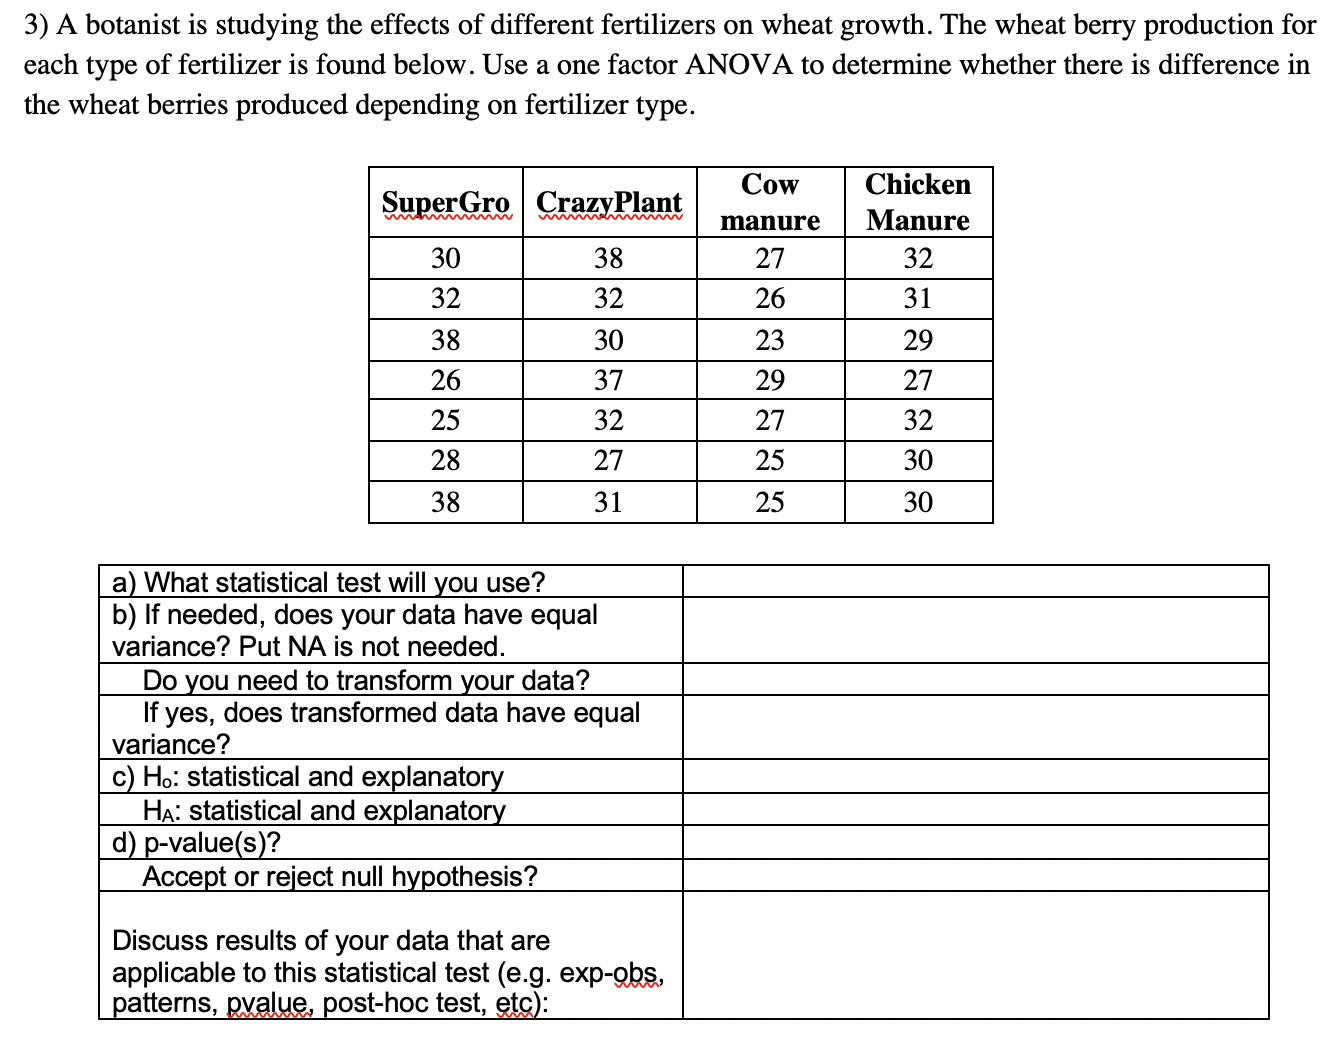
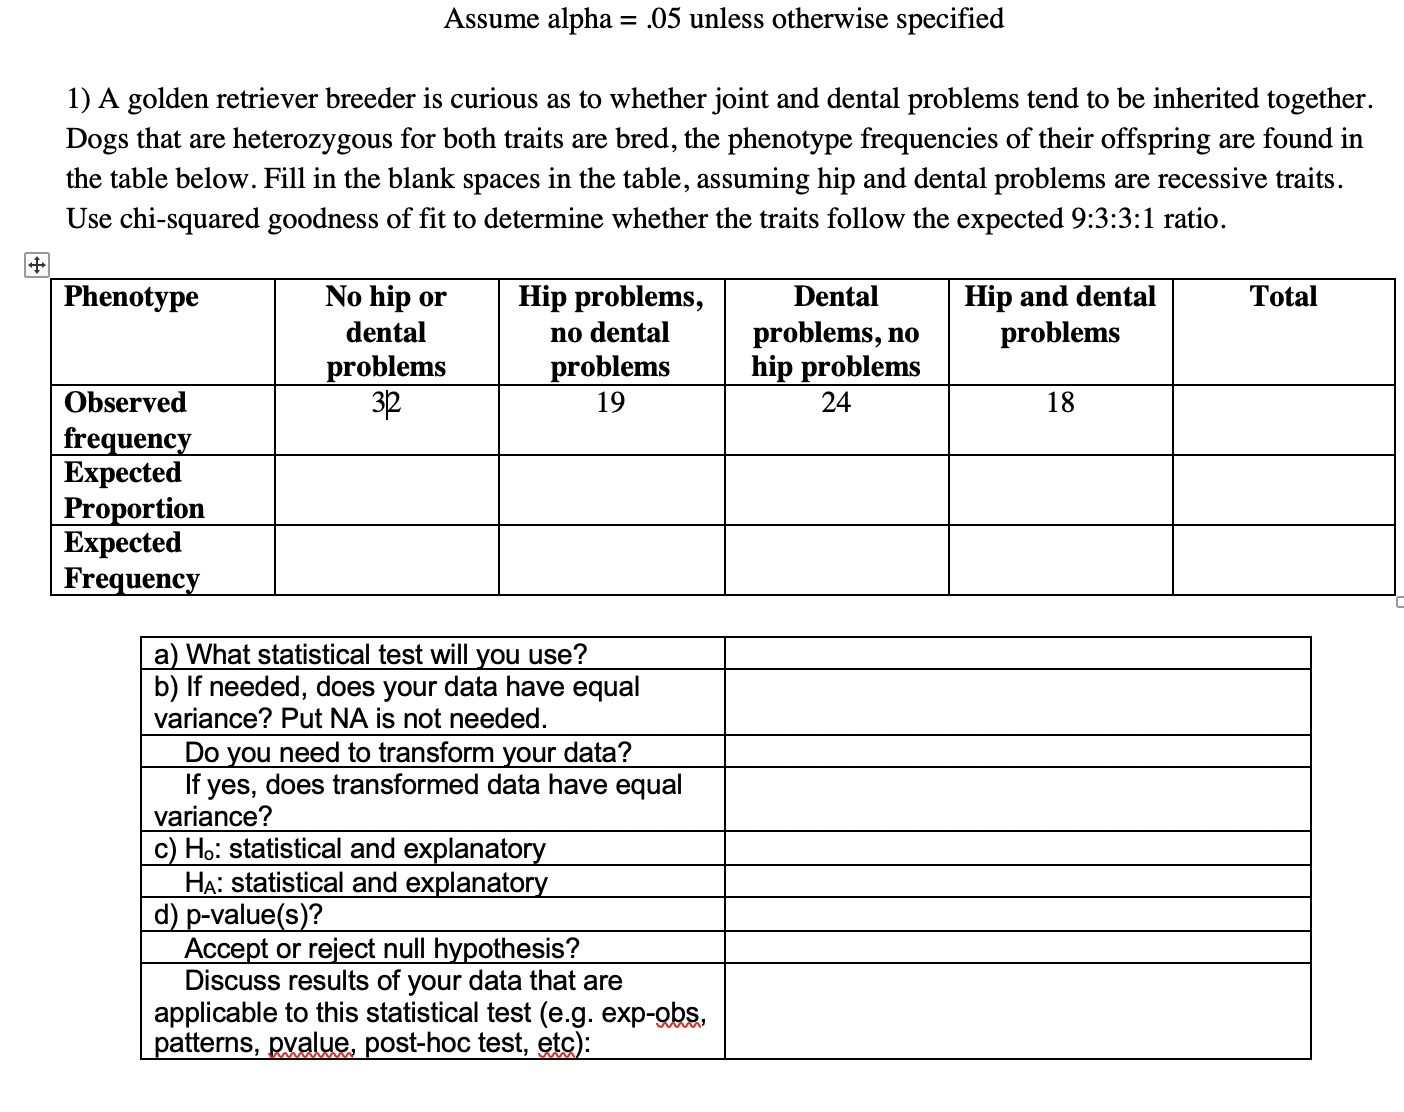
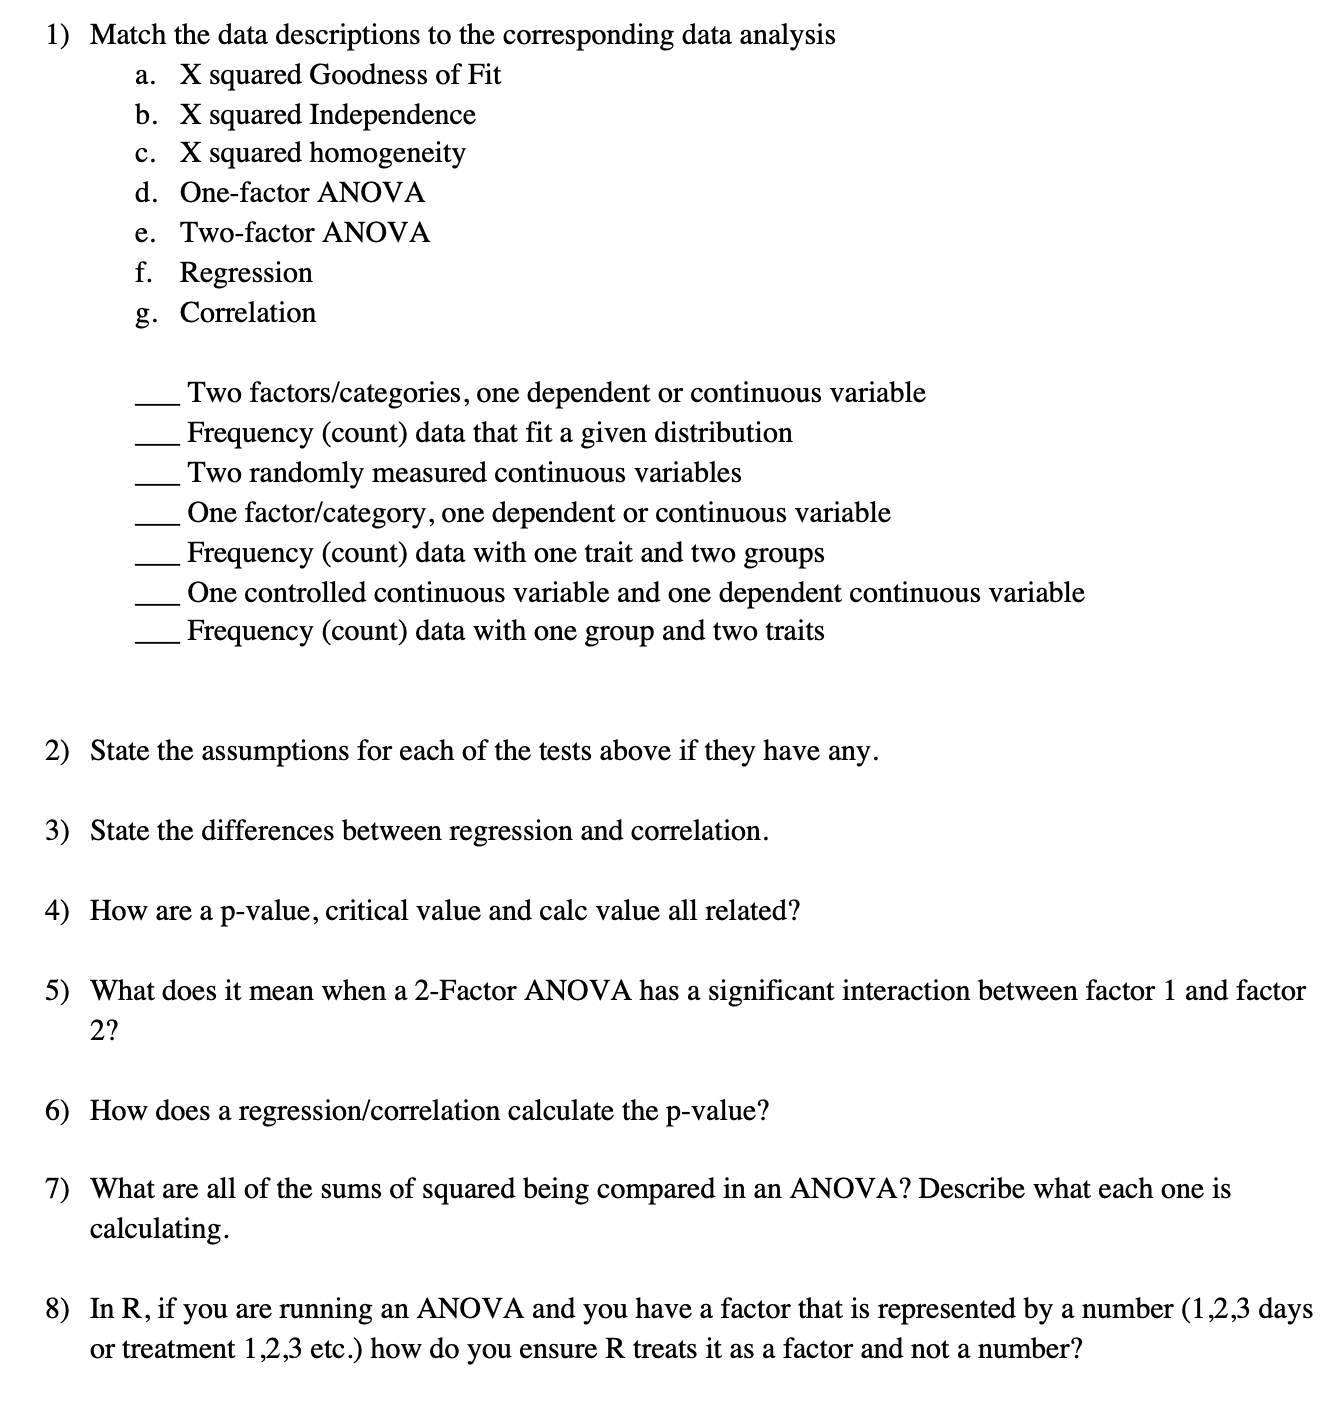
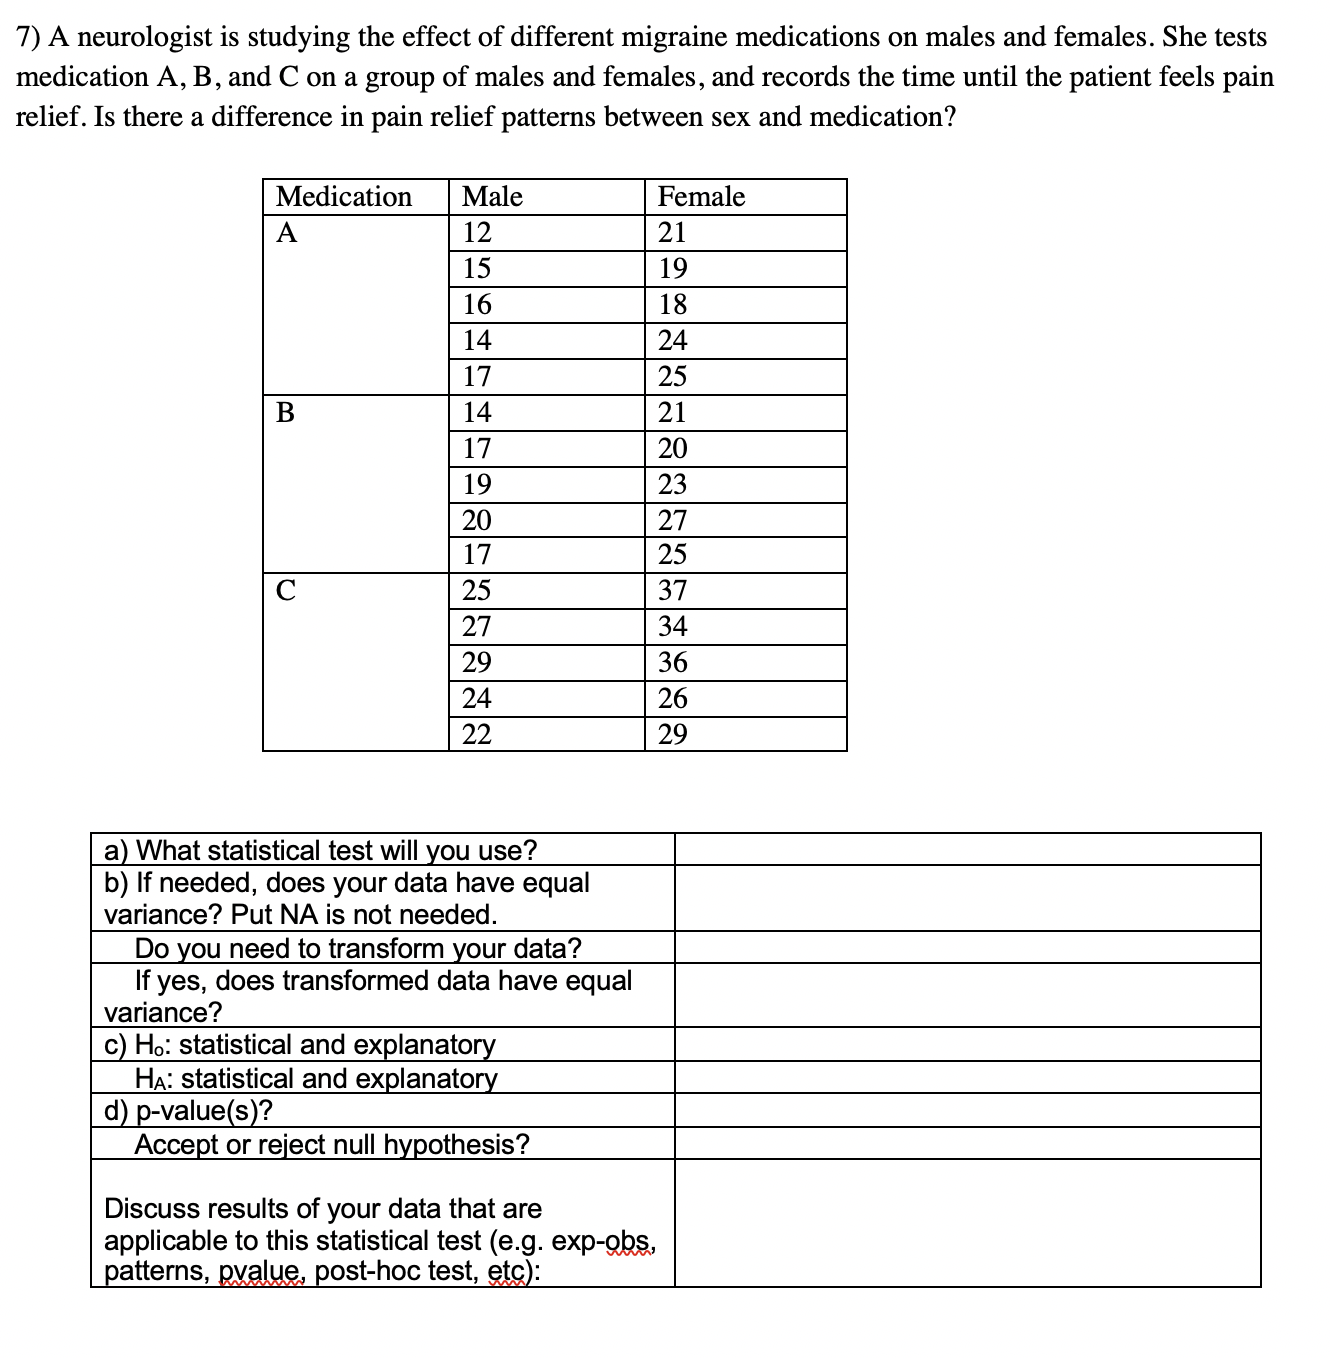
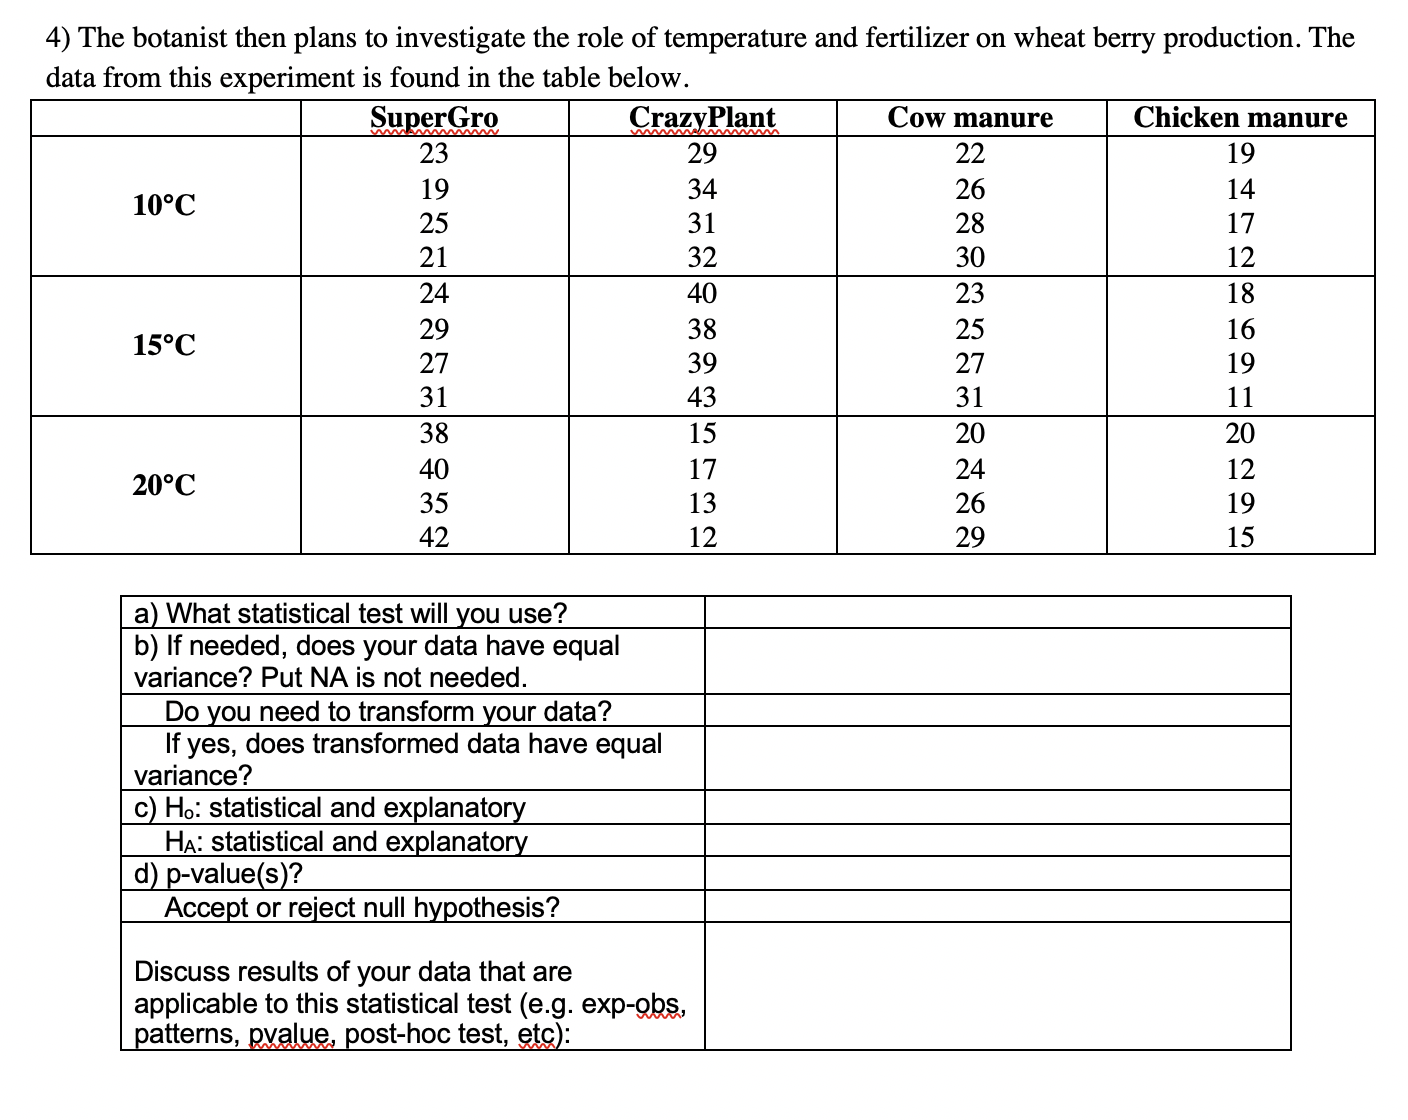
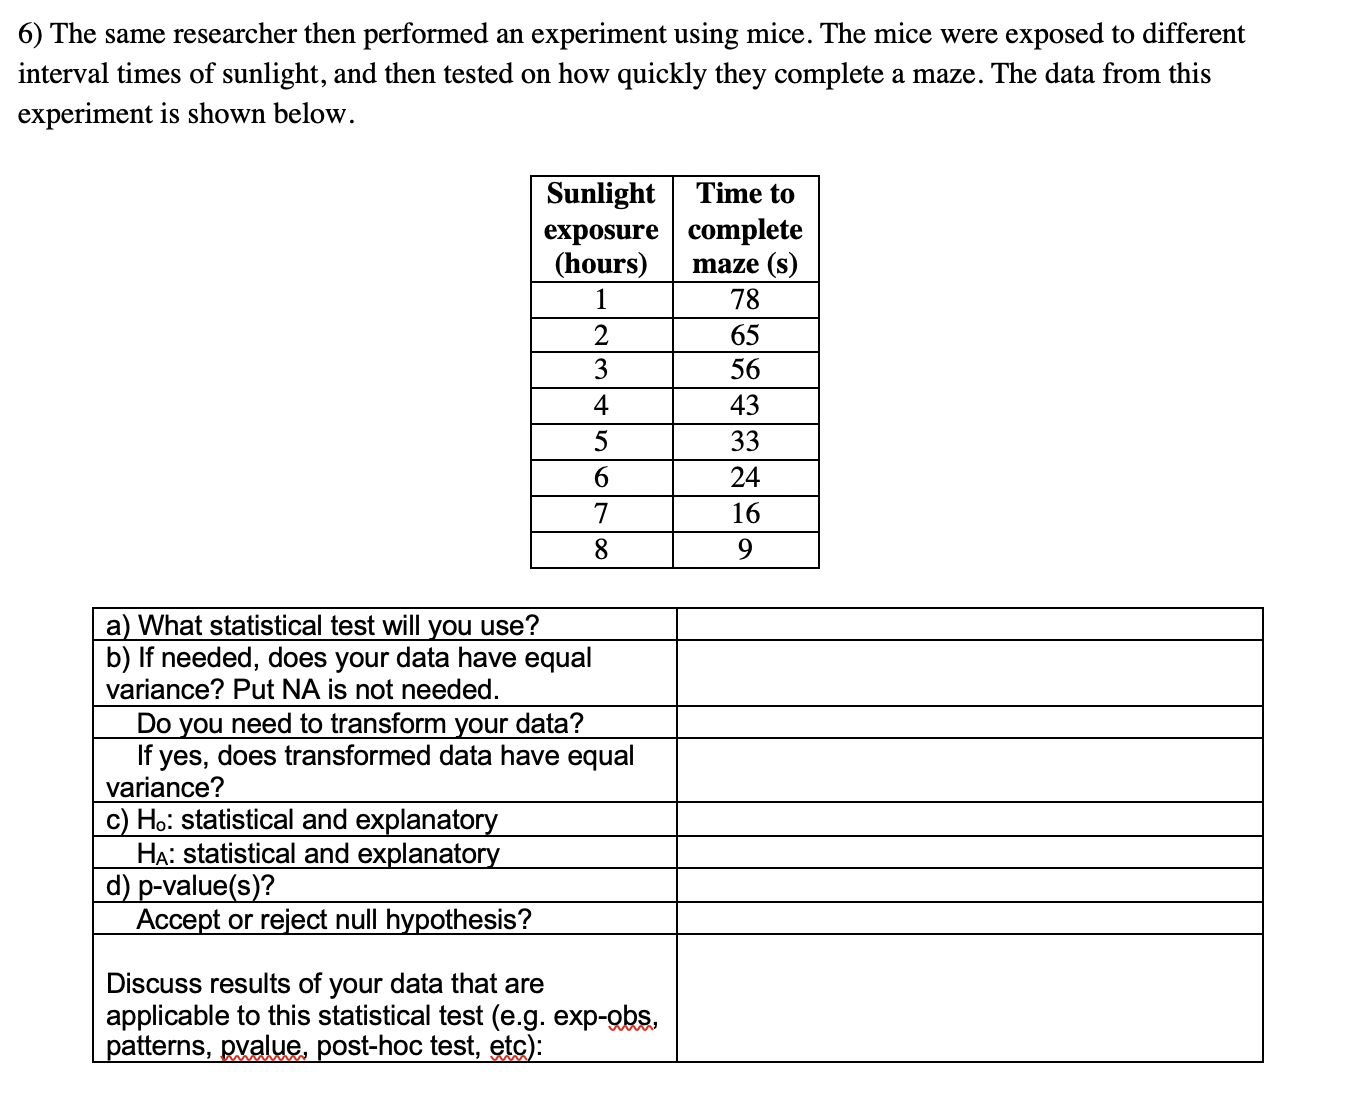
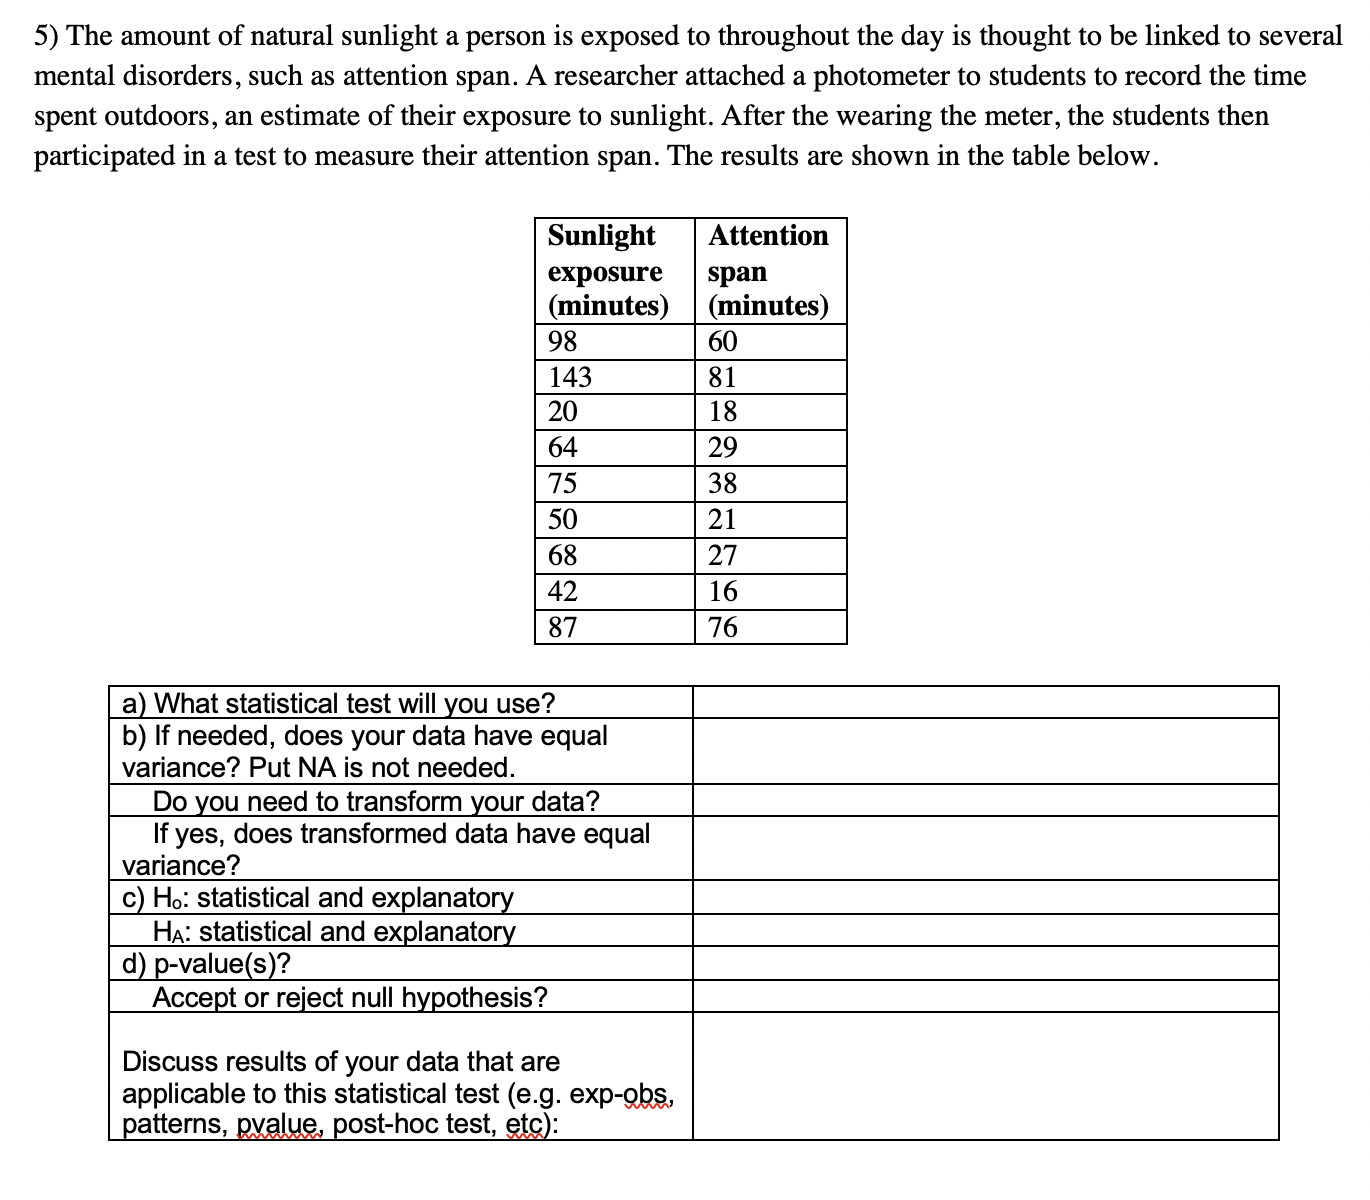
2) Chronic wasting disease (CWD) is a brain disease of deer and elk, and it is one of a group of diseases called transmissible spongiform encephalopathies (TSEs) associated with the presence of prions (like mad cow disease). Characterized by long incubation periods, CWD takes years to develop. A study was conducted over a 3-year period. Deer were caught in the wild and tested for infection. Their age and sex was recorded, along with the region (core area or marginal area) where they were caught. The table below summarizes the infections of males and females in the area. Infected Not infected Male 62 38 Female 55 71 a) What statistical test will you use? b) If needed, does your data have equal variance? Put NA is not needed Do you need to transform your data? If yes, does transformed data have equal variance? c) Ho: statistical and explanatory HA: statistical and explanatory d) p-value(s)? Accept or reject null hypothesis? Discuss results of your data that are applicable to this statistical test (e.g. exp-obs patterns, pvalue, post-hoc test, etc):3) A botanist is studying the effects of different fertilizers on wheat growth. The wheat berry production for each type of fertilizer is found below. Use a one factor ANOVA to determine whether there is difference in the wheat berries produced depending on fertilizer type. SuperGro CrazyPlant Cow Chicken manure Manure 30 38 27 32 32 32 26 31 38 30 23 29 26 37 29 27 25 32 27 32 28 27 25 30 38 31 25 30 a) What statistical test will you use? b) If needed, does your data have equal variance? Put NA is not needed Do you need to transform your data? If yes, does transformed data have equal variance? c) Ho: statistical and explanatory HA: statistical and explanatory d) p-value(s)? Accept or reject null hypothesis? Discuss results of your data that are applicable to this statistical test (e.g. exp-obs, patterns, pvalue, post-hoc test, etc):Assume alpha = .05 unless otherwise specified 1) A golden retriever breeder is curious as to whether joint and dental problems tend to be inherited together. Dogs that are heterozygous for both traits are bred, the phenotype frequencies of their offspring are found in the table below. Fill in the blank spaces in the table, assuming hip and dental problems are recessive traits. Use chi-squared goodness of fit to determine whether the traits follow the expected 9:3:3:1 ratio. + Phenotype No hip or Hip problems, Dental Hip and dental Total dental no dental problems, no problems problems problems hip problems Observed 3 2 19 24 18 frequency Expected Proportion Expected Frequency a) What statistical test will you use? b) If needed, does your data have equal variance? Put NA is not needed. Do you need to transform your data? f yes, does transformed data have equal variance? c) Ho: statistical and explanatory HA: statistical and explanatory d) p-value(s)? Accept or reject null hypothesis? Discuss results of your data that are applicable to this statistical test (e.g. exp-obs, patterns, pvalue, post-hoc test, etc):1) 2) 3) 4) 5) 6) 7) 3) Match the data descriptions to the corresponding data analysis a. X squared Goodness of Fit X squared Independence X squared homogeneity One-factor ANOVA Two-factor AN OVA Regression Correlation Carmen? _ Two factors/categories, one dependent or continuous variable _ Frequency (count) data that fit a given distribution _ Two randomly measured continuous variables _ One factor/category, one dependent or continuous variable _ Frequency (count) data with one trait and two groups _ One controlled continuous variable and one dependent continuous variable _ Frequency (count) data with one group and two traits State the assumptions for each of the tests above if they have any. State the differences between regression and correlation. How are a pvalue, critical value and calc value all related? What does it mean when a 2Factor AN OVA has a signicant interaction between factor 1 and factor 2? How does a regression/correlation calculate the pvalue? What are all of the sums of squared being compared in an AN OVA? Describe what each one is calculating. In R, if you are running an ANOVA and you have a factor that is represented by a number (1,2,3 days or treatment 1,2,3 etc.) how do you ensure R treats it as a factor and not a number? 7) A neurologist is studying the effect of different migraine medications on males and females. She tests medication A, B, and C on a group of males and females, and records the time until the patient feels pain relief. Is there a difference in pain relief patterns between sex and medication? Medication Male Female A 12 21 15 19 16 18 14 24 17 25 B 14 21 17 20 19 23 20 27 17 25 C 25 37 27 34 29 36 24 26 22 29 a) What statistical test will you use? b) If needed, does your data have equal variance? Put NA is not needed. Do you need to transform your data? If yes, does transformed data have equal variance? c) Ho: statistical and explanatory HA: statistical and explanatory d) p-value(s) Accept or reject null hypothesis? Discuss results of your data that are applicable to this statistical test (e.g. exp-obs, patterns, pvalue, post-hoc test, etc):4) The botanist then plans to investigate the role of temperature and fertilizer on wheat berry production. The data from this experiment is found in the table below. SuperGro CrazyPlant Cow manure Chicken manure 23 29 22 19 10.C 19 34 26 25 14 31 28 21 17 32 30 12 24 40 23 18 15.C 29 38 25 27 16 39 31 27 43 19 31 11 38 15 20 40 20 20 C 17 24 35 12 13 26 42 12 19 29 15 a) What statistical test will you use? b) If needed, does your data have equal variance? Put NA is not needed. Do you need to transform your data? If yes, does transformed data have equal variance? c) Ho: statistical and explanatory HA: statistical and explanatory d) p-value(s)? Accept or reject null hypothesis? Discuss results of your data that are applicable to this statistical test (e.g. exp-obs, patterns, pvalue, post-hoc test, etc):6) The same researcher then performed an experiment using mice. The mice were exposed to different interval times of sunlight, and then tested on how quickly they complete a maze. The data from this experiment is shown below. Sunlight Time to exposure complete (hours) maze (s) 1 78 JOUAWN 65 56 43 33 24 16 8 9 a) What statistical test will you use? b) If needed, does your data have equal variance? Put NA is not needed Do you need to transform your data? If yes, does transformed data have equal variance? c) Ho: statistical and explanatory HA: statistical and explanatory d) p-value(s)? Accept or reject null hypothesis? Discuss results of your data that are applicable to this statistical test (e.g. exp-obs, patterns, pvalue, post-hoc test, etc):5) The amount of natural sunlight a person is exposed to throughout the day is thought to be linked to several mental disorders, such as attention span. A researcher attached a photometer to students to record the time spent outdoors, an estimate of their exposure to sunlight. After the wearing the meter, the students then participated in a test to measure their attention span. The results are shown in the table below. Sunlight Attention exposure span a What statistical test will ou use? b) If needed, does your data have equal variance? Put NA is not needed. Discuss results of your data that are applicable to this statistical test (9.9. exp-ops, attems, :___:__...: uost-hoc test, -___
Step by Step Solution
There are 3 Steps involved in it

Get step-by-step solutions from verified subject matter experts