

Question: This is for my python programming class Create a plot of the graph of the function y-23+2+1 over the interval [-2, 1]. On top of
This is for my python programming class
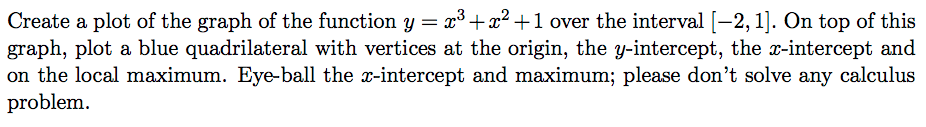
Create a plot of the graph of the function y-23+2+1 over the interval [-2, 1]. On top of this graph, plot a blue quadrilateral with vertices at the origin, the y-intercept, the x-intercept and on the local maximum. Eye-ball the x-intercept and maximum; please don't solve any calculus
Step by Step Solution
There are 3 Steps involved in it
1 Expert Approved Answer
Step: 1 Unlock

Question Has Been Solved by an Expert!
Get step-by-step solutions from verified subject matter experts
Step: 2 Unlock
Step: 3 Unlock