

Question: THIS IS FOR STAT PLEASE ANSWER ASAP A GREAT REVIEW IS PROMISE Chi-square distribution table Area to the Right of the Critical Value Degrees of
THIS IS FOR STAT PLEASE ANSWER ASAP A GREAT REVIEW IS PROMISE
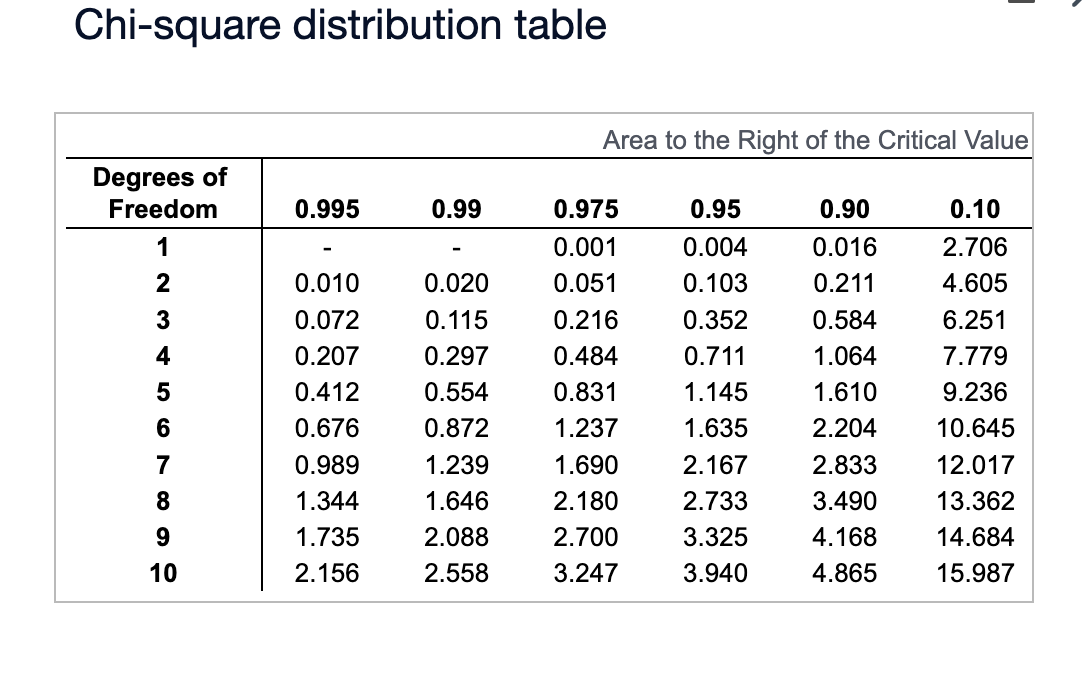
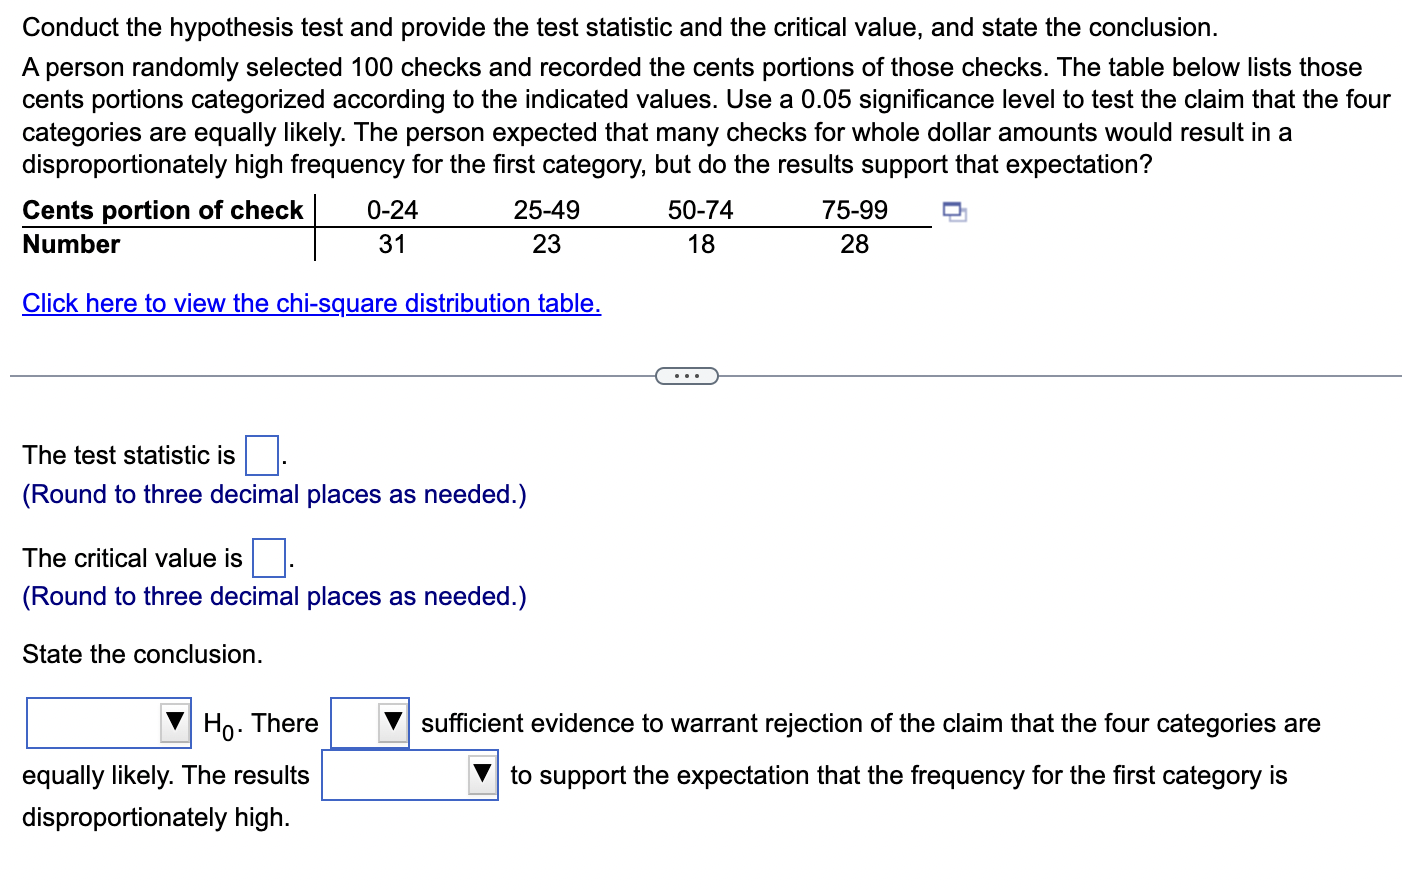
Chi-square distribution table Area to the Right of the Critical Value Degrees of Freedom 0.995 0.99 0.975 0.95 0.90 0.10 0.001 0.004 0.016 2.706 0.010 0.020 0.051 0.103 0.211 4.605 0.072 0.115 0.216 0.352 0.584 6.251 0.207 0.297 0.484 0.711 1.064 7.779 0.412 0.554 0.831 1.145 1.610 9.236 0.676 0.872 1.237 1.635 2.204 10.645 0.989 1.239 1.690 2.167 2.833 12.017 1.344 1.646 2.180 2.733 3.490 13.362 1.735 2.088 2.700 3.325 4.168 14.684 10 2. 156 2.558 3.247 3.940 4.865 15.987Conduct the hypothesis test and provide the test statistic and the critical value, and state the conclusion. A person randomly selected 100 checks and recorded the cents portions of those checks. The table below lists those cents portions categorized according to the indicated values. Use a 0.05 significance level to test the claim that the four categories are equally likely. The person expected that many checks for whole dollar amounts would result in a disproportionately high frequency for the first category, but do the results support that expectation? Cents portion of check | 0-24 25-49 50-74 75-99 Number 31 23 18 28 Click here to view the chi-square distribution table. . . . The test statistic is (Round to three decimal places as needed.) The critical value is (Round to three decimal places as needed.) State the conclusion. Ho. There sufficient evidence to warrant rejection of the claim that the four categories are equally likely. The results to support the expectation that the frequency for the first category is disproportionately high
Step by Step Solution
There are 3 Steps involved in it

Get step-by-step solutions from verified subject matter experts