

Question: THIS IS FOR STAT PLEASE ANSWER CEARLY ANS ASAP Period 3 Year 5 Year 2019 JAN 4.00 4.59 FEB 3.97 4.52 MAR 3.92 4.44 APR
THIS IS FOR STAT PLEASE ANSWER CEARLY ANS ASAP
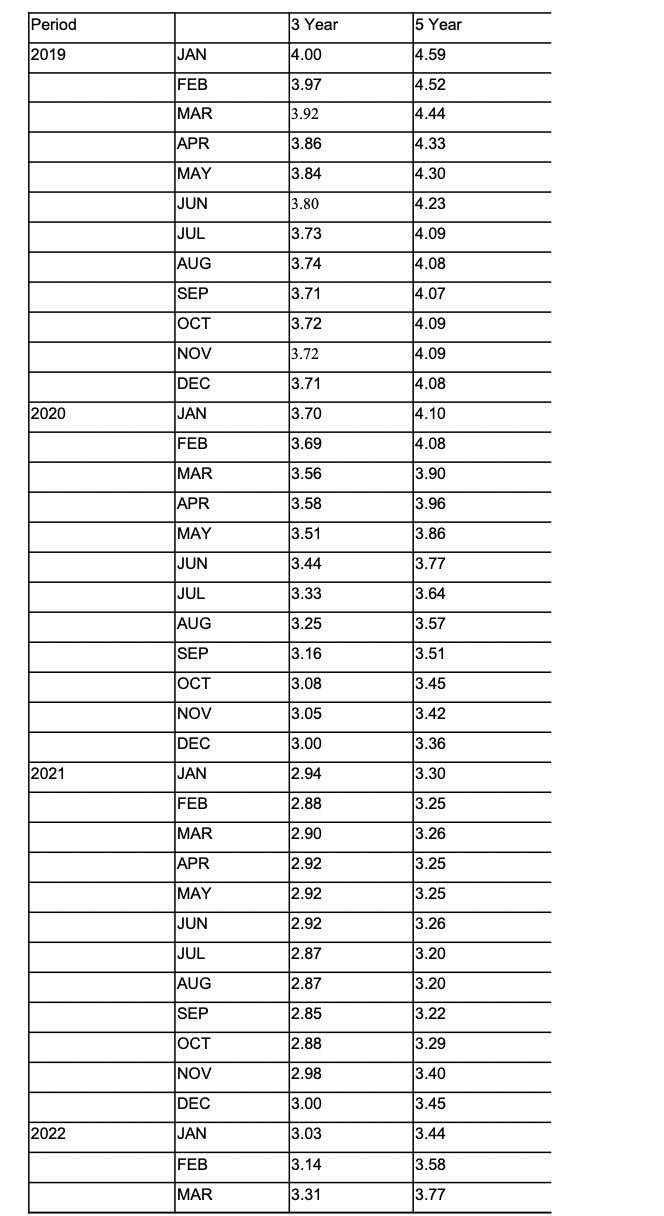
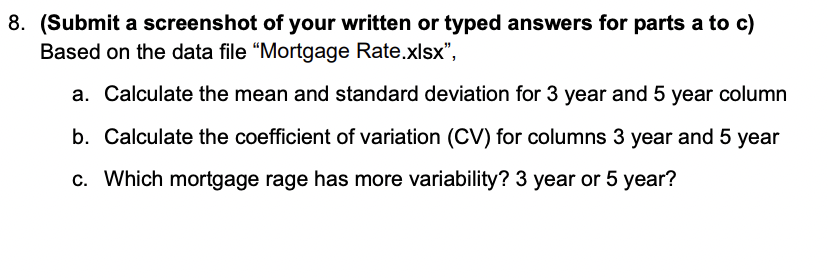
Period 3 Year 5 Year 2019 JAN 4.00 4.59 FEB 3.97 4.52 MAR 3.92 4.44 APR 3.86 4.33 MAY 3.84 4.30 JUN 3.80 4.23 JUL 3.73 4.09 AUG 3.74 4.08 SEP 3.71 4.07 OCT 3.72 4.09 NOV 3.72 4.09 DEC 3.71 4.08 2020 JAN 3.70 4.10 FEB 3.69 4.08 MAR 3.56 3.90 APR 3.58 3.96 MAY 3.51 3.86 JUN 3.44 3.77 JUL 3.33 3.64 AUG 3.25 3.57 SEP 3.16 3.51 OCT 3.08 3.45 NOV 3.05 3.42 DEC 3.00 3.36 2021 JAN 2.94 3.30 FEB 2.88 3.25 MAR 2.90 3.26 APR 2.92 3.25 MAY 2.92 3.25 JUN 2.92 3.26 JUL 2.87 3.20 AUG 2.87 3.20 SEP 2.85 3.22 OCT 2.88 3.29 NOV 2.98 3.40 DEC 3.00 3.45 2022 JAN 3.03 3.44 FEB 3.14 3.58 MAR 3.31 3.778. (Submit a screenshot of your written or typed answers for parts a to c) Based on the data file "Mortgage Rate.xisx", a. Calculate the mean and standard deviation for 3 year and 5 year column b. Calculate the coefficient of variation (CV) for columns 3 year and 5 year c. Which mortgage rage has more variability? 3 year or 5 year
Step by Step Solution
There are 3 Steps involved in it

Get step-by-step solutions from verified subject matter experts