

Question: THIS IS FOR STAT PLEASE ANSWER CLEARLY Q1: Assume that the Poisson distribution applies and that the mean number of hurricanes in a certain area


THIS IS FOR STAT PLEASE ANSWER CLEARLY
Q1:


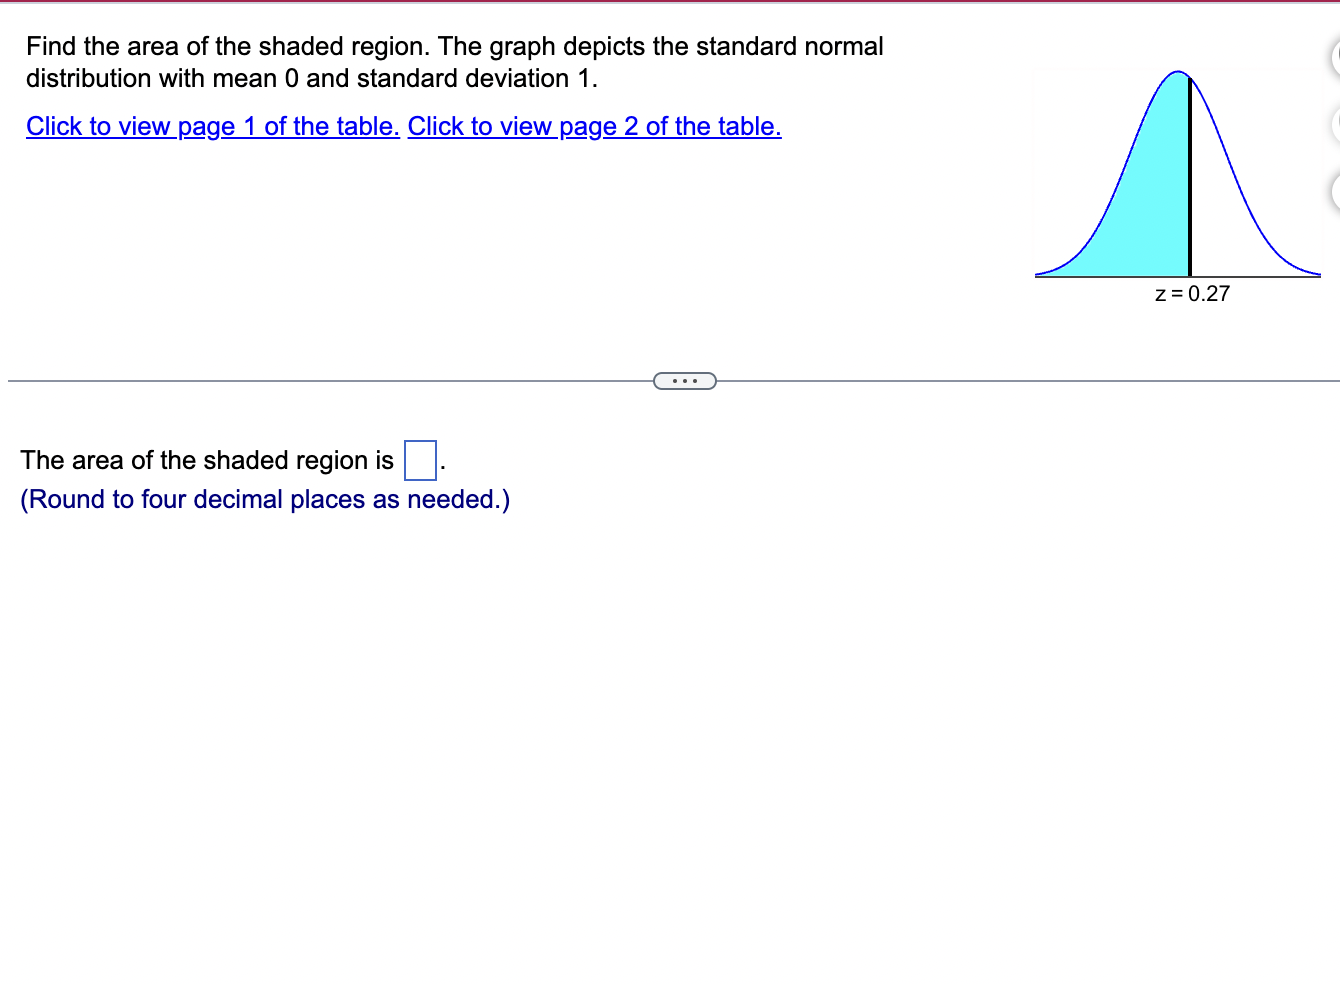
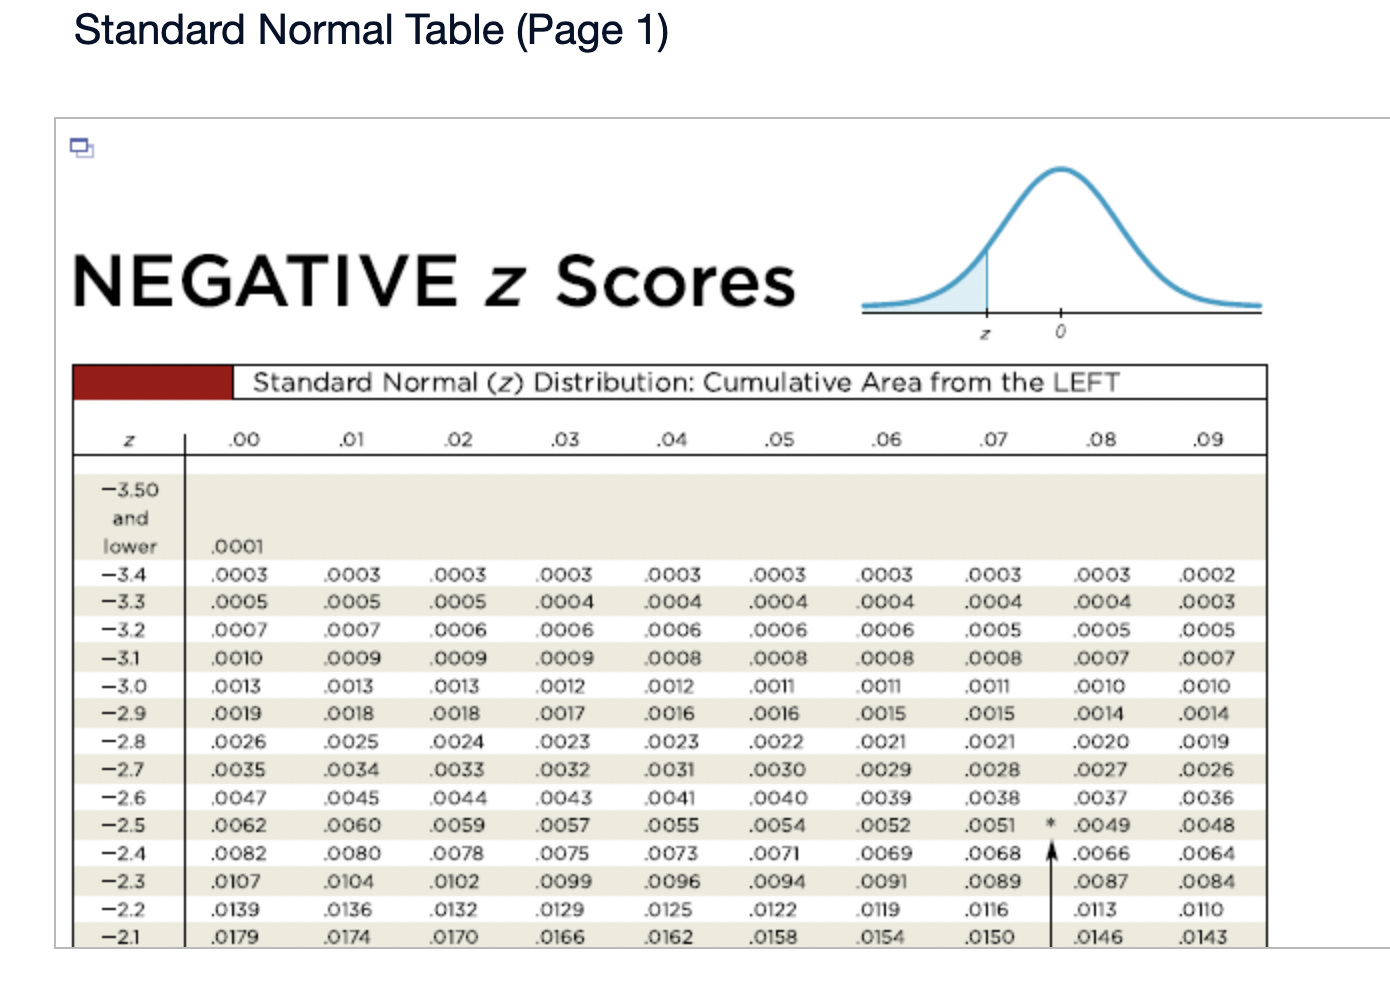


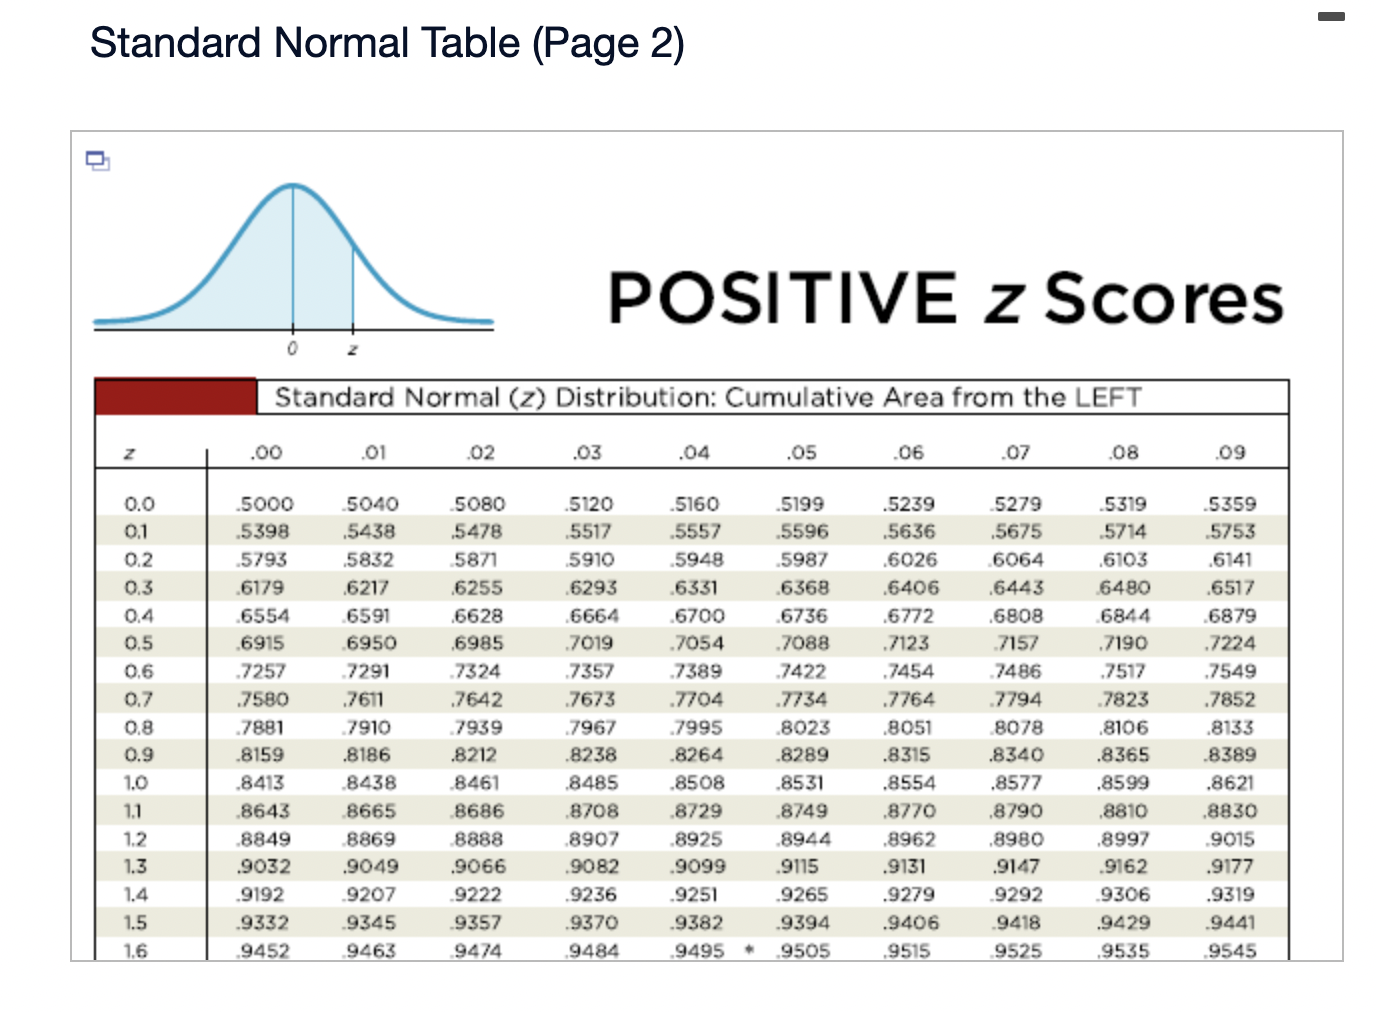


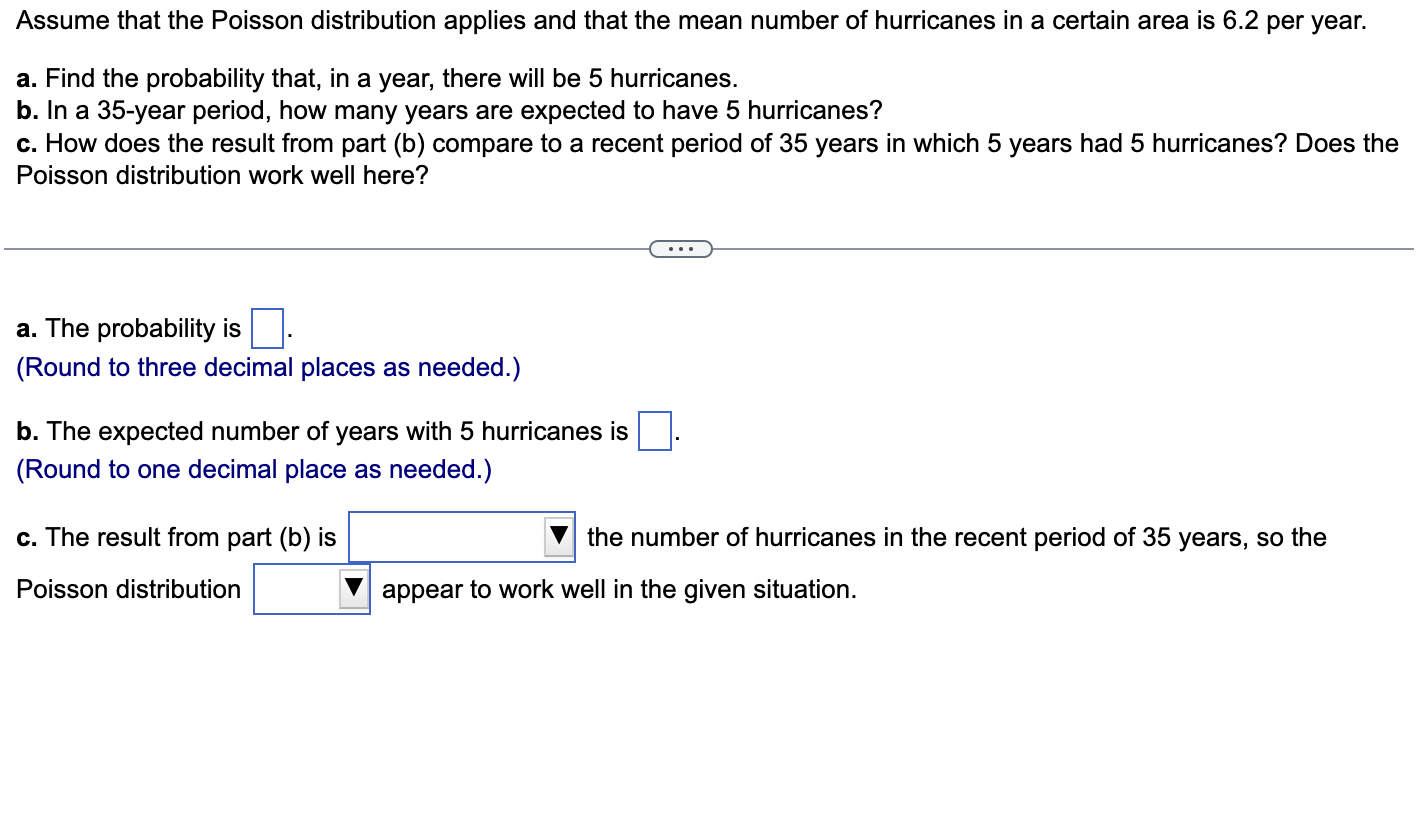
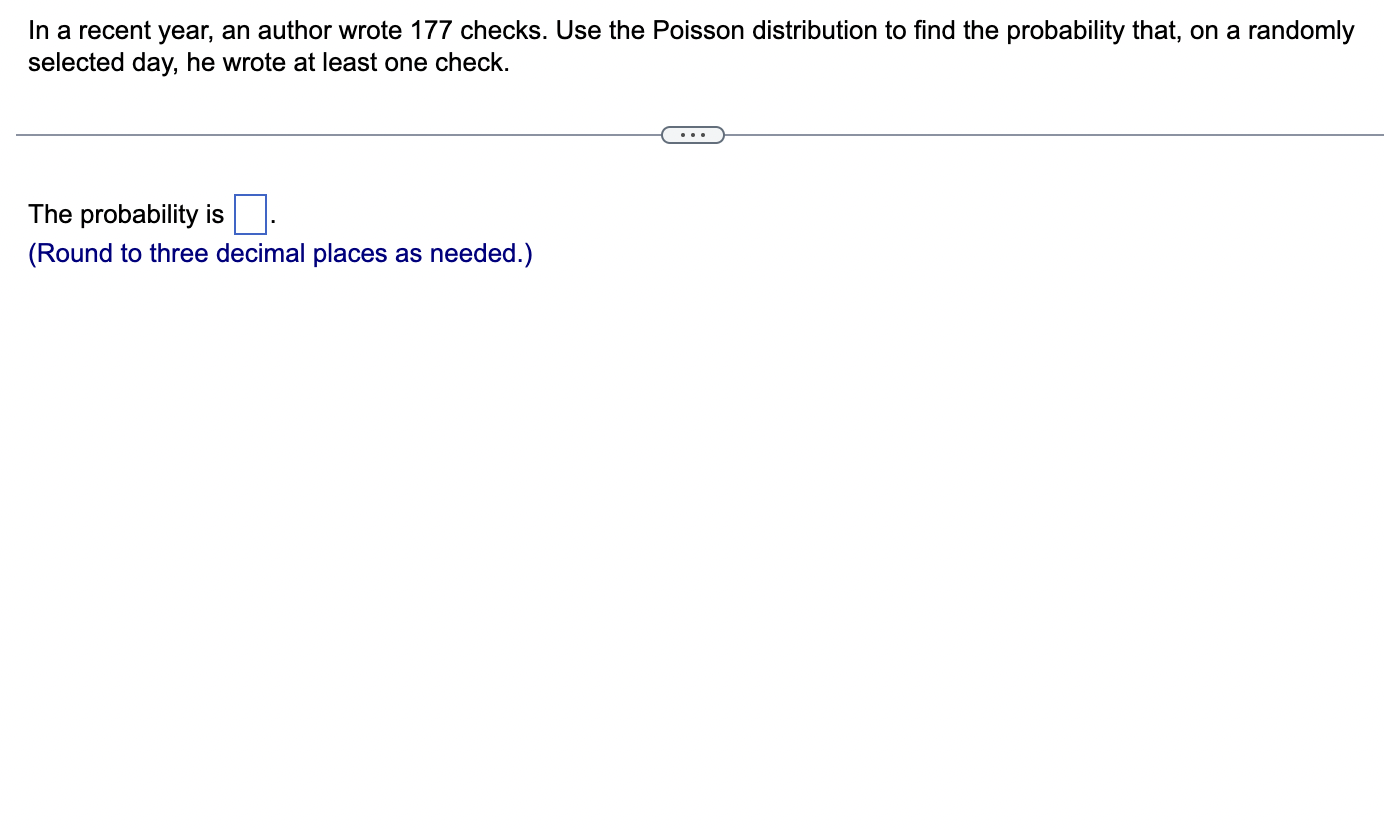
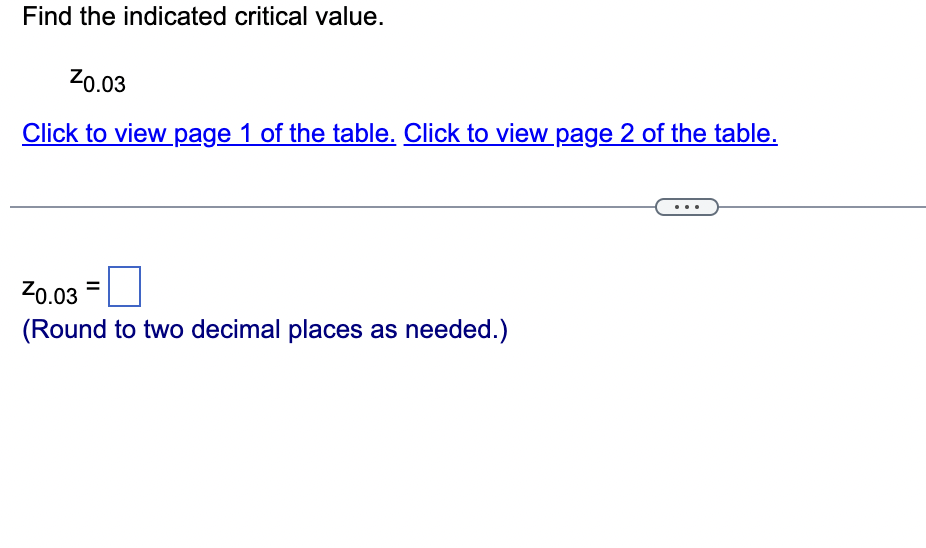
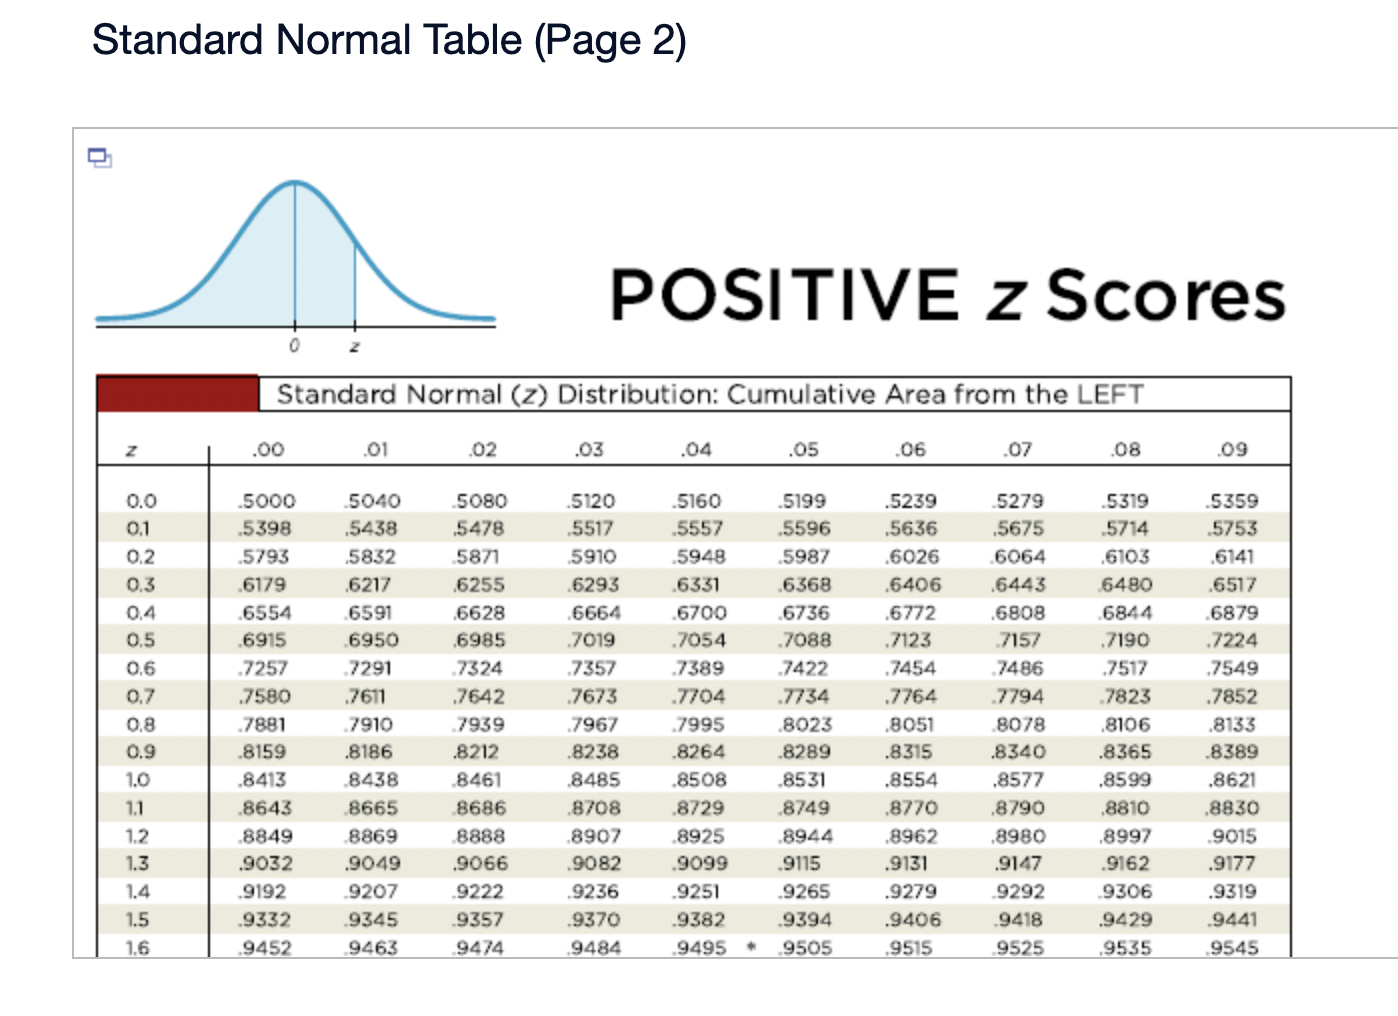
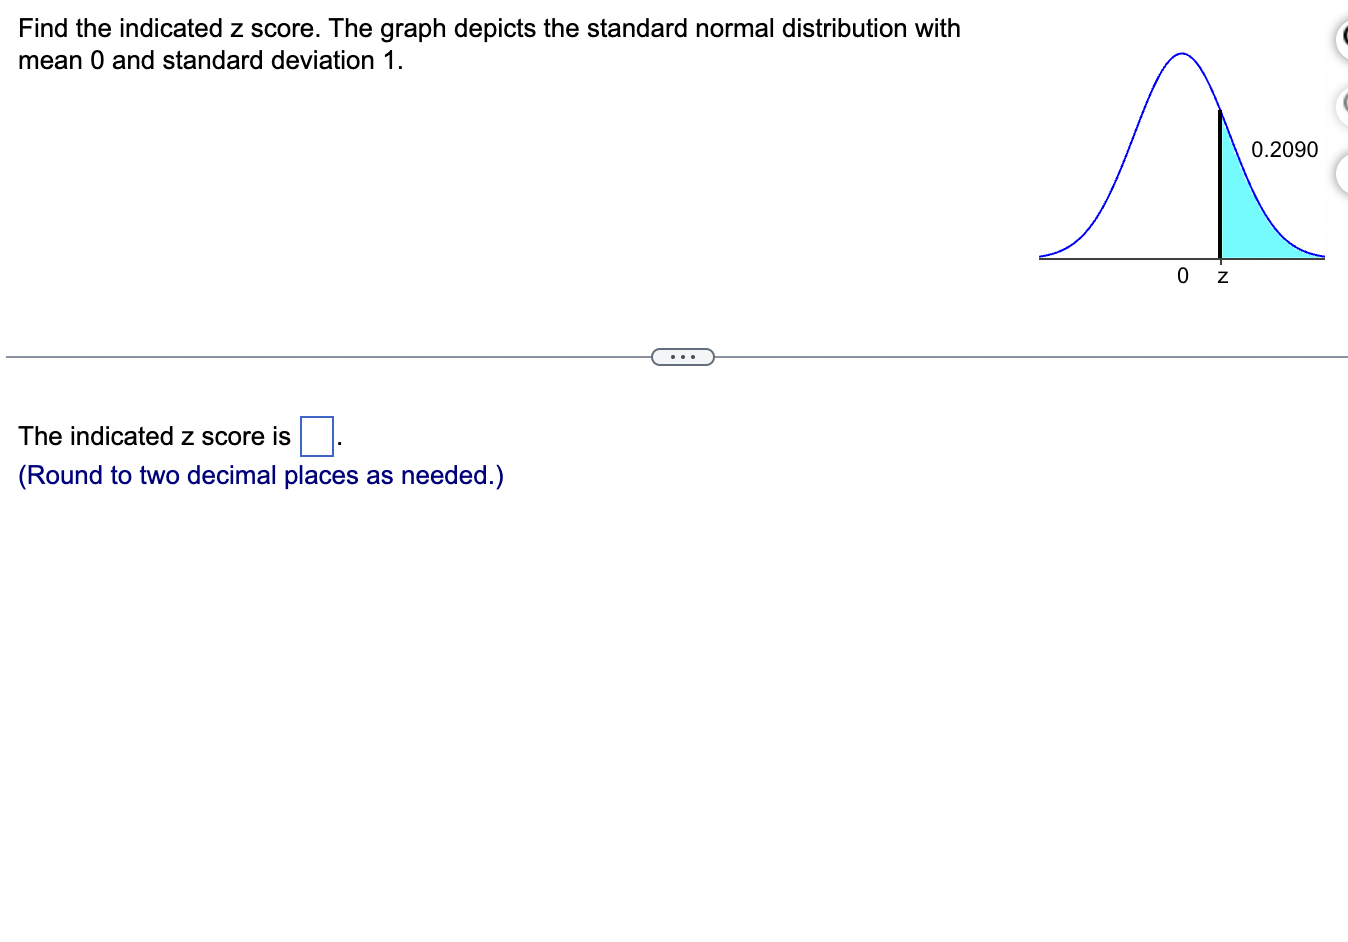
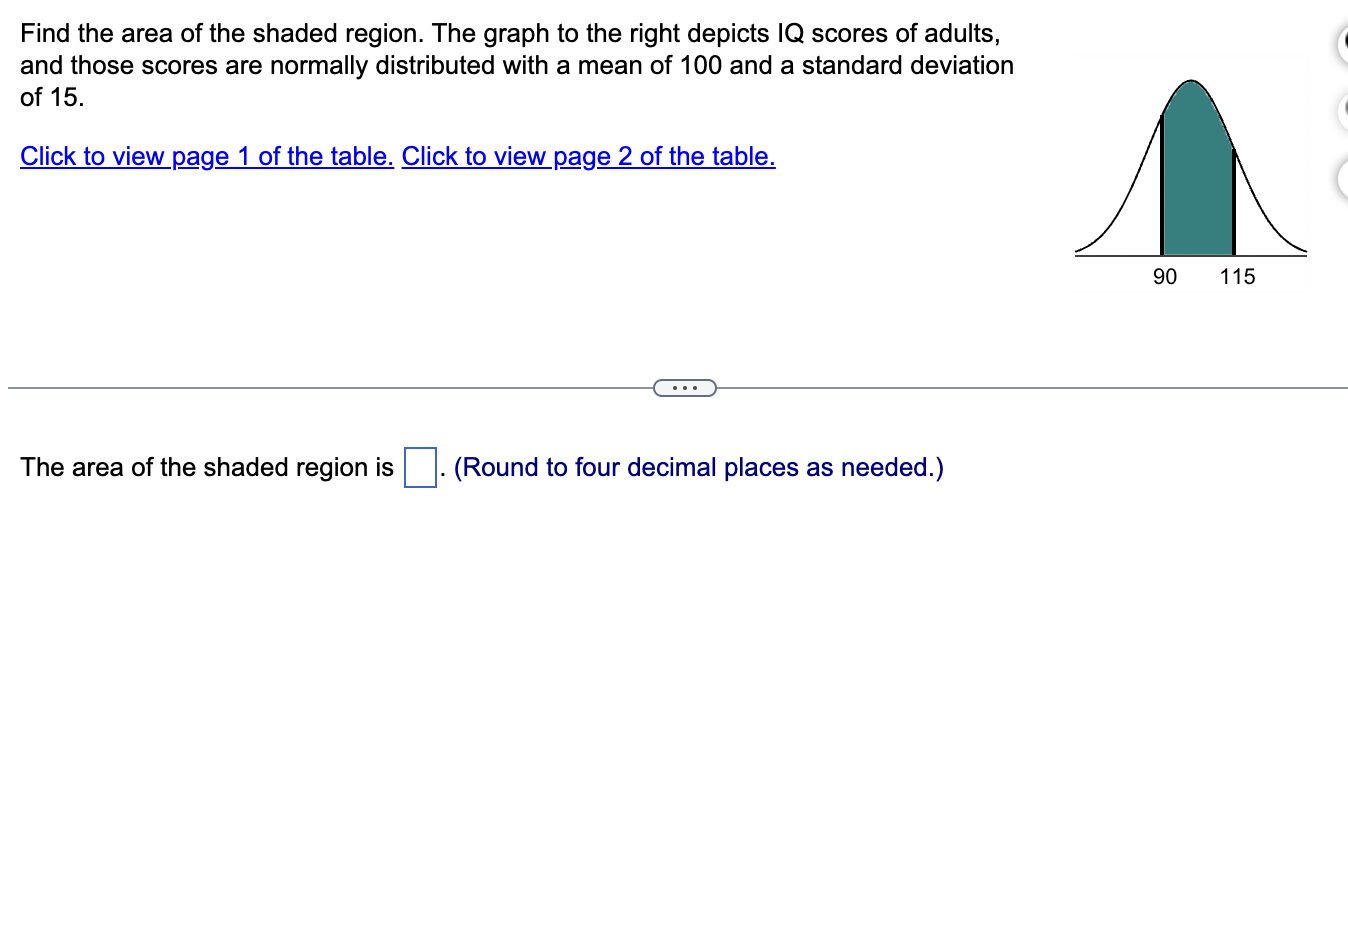
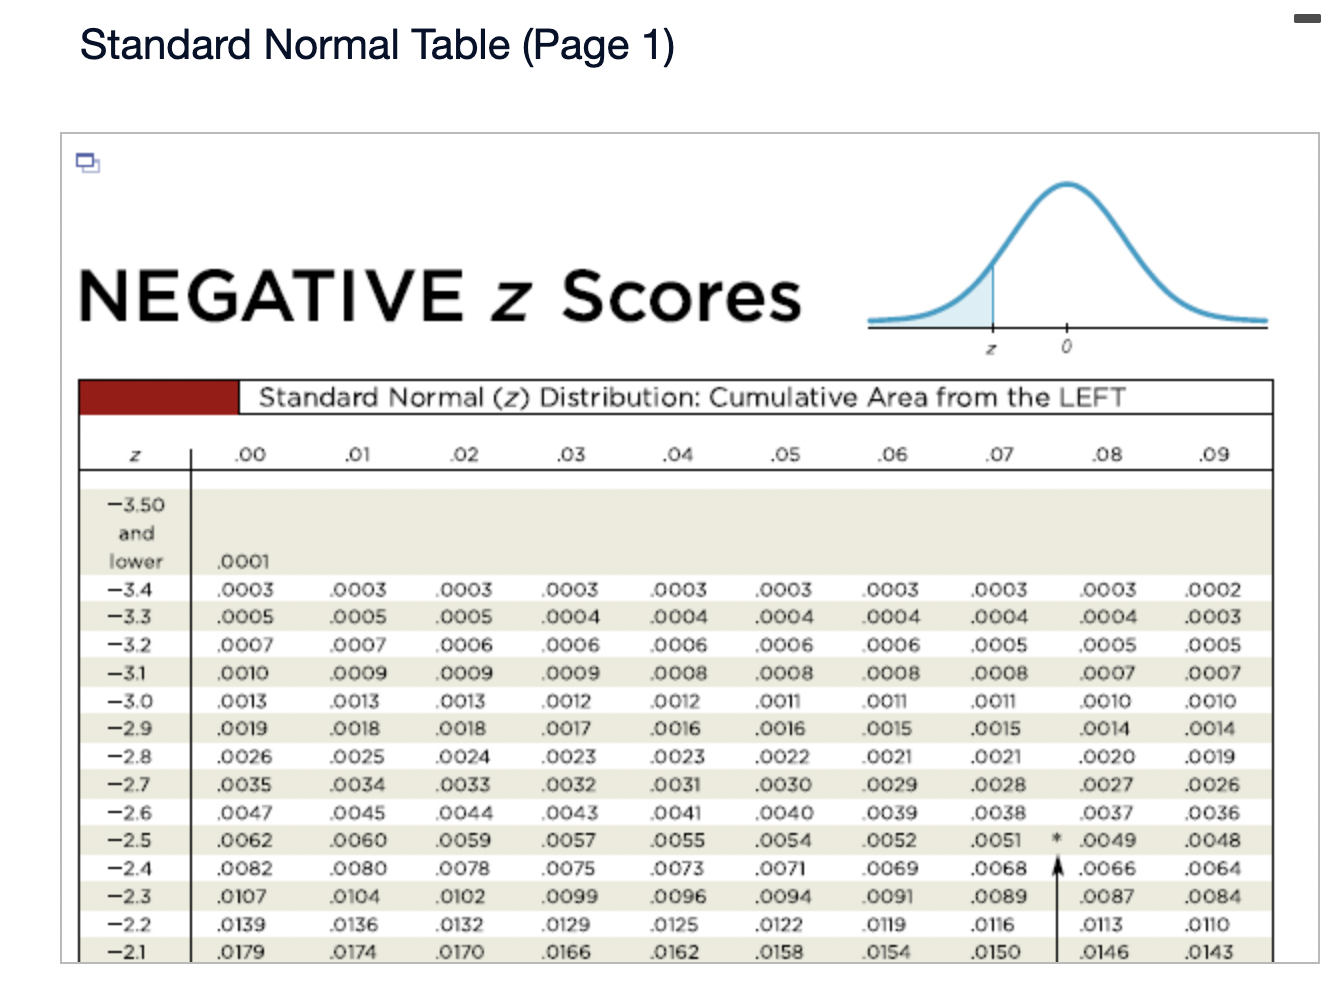
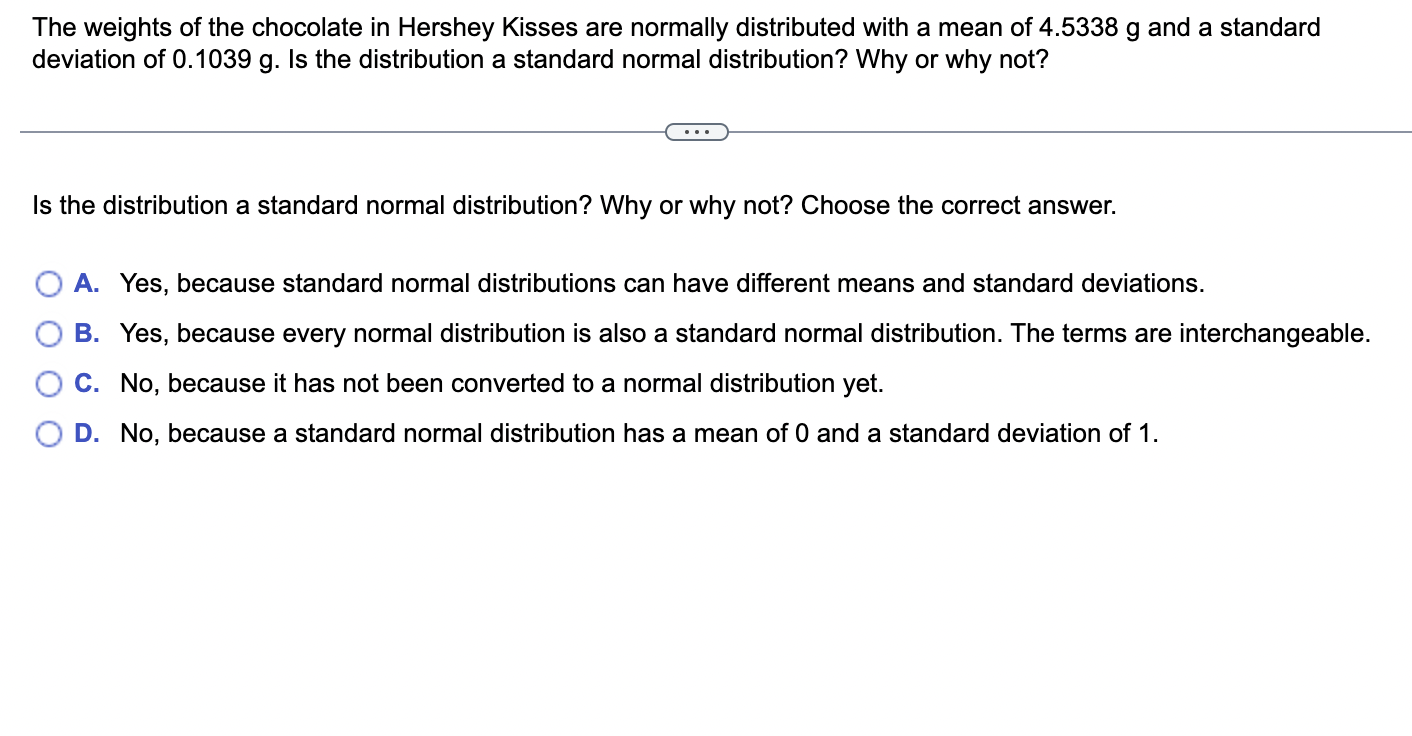
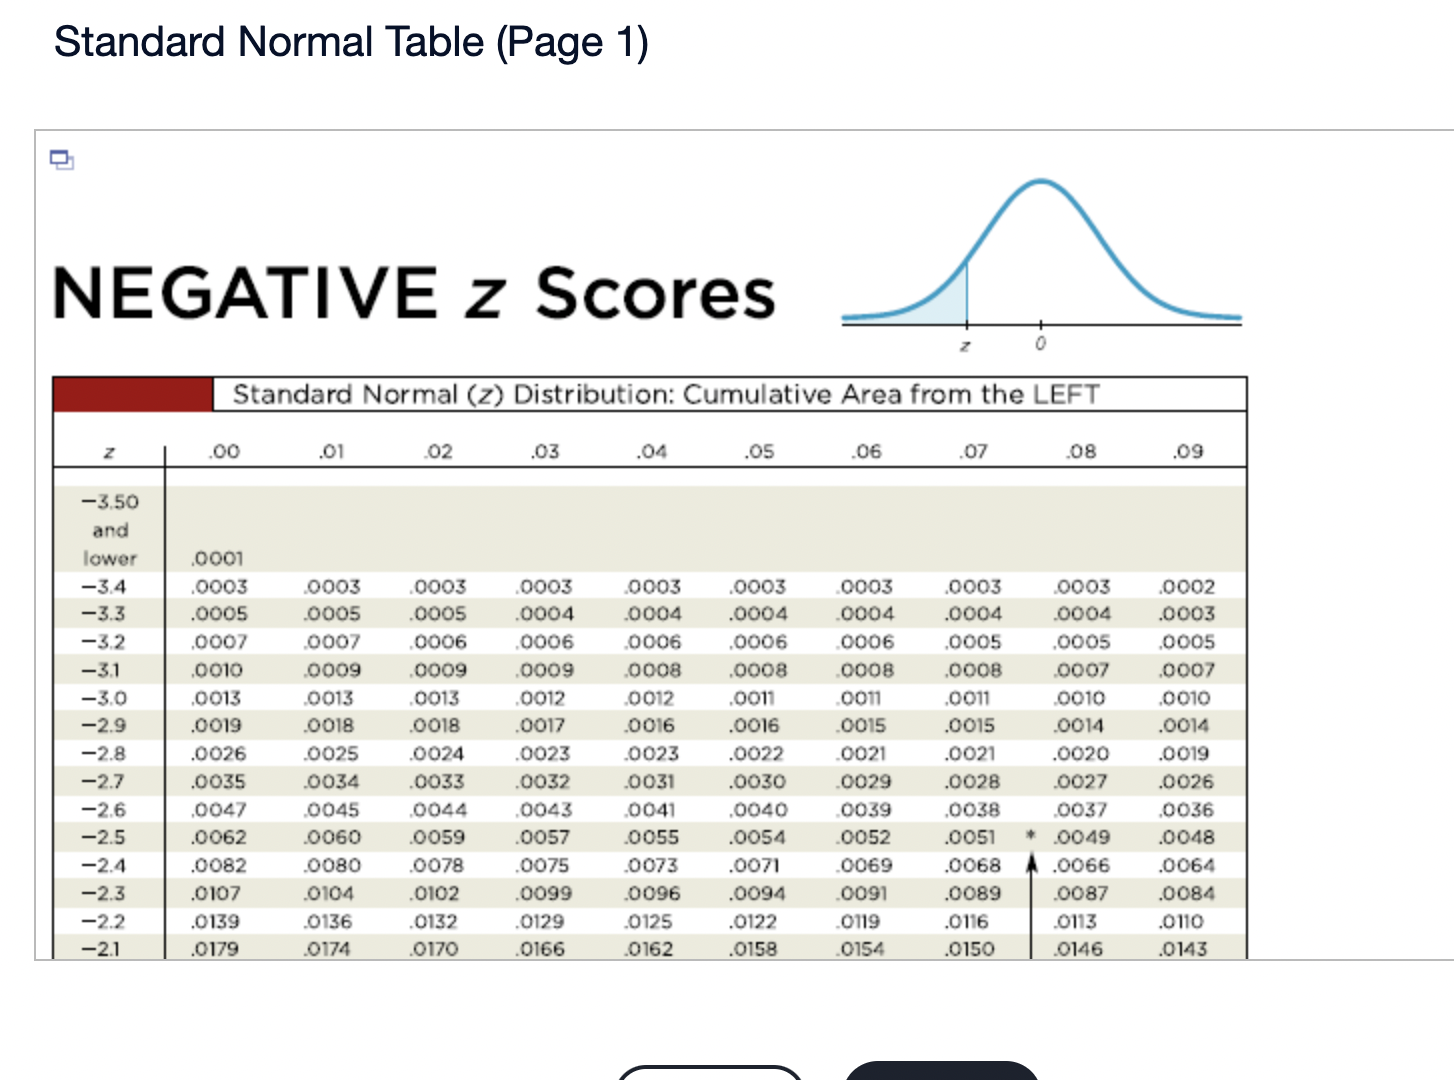
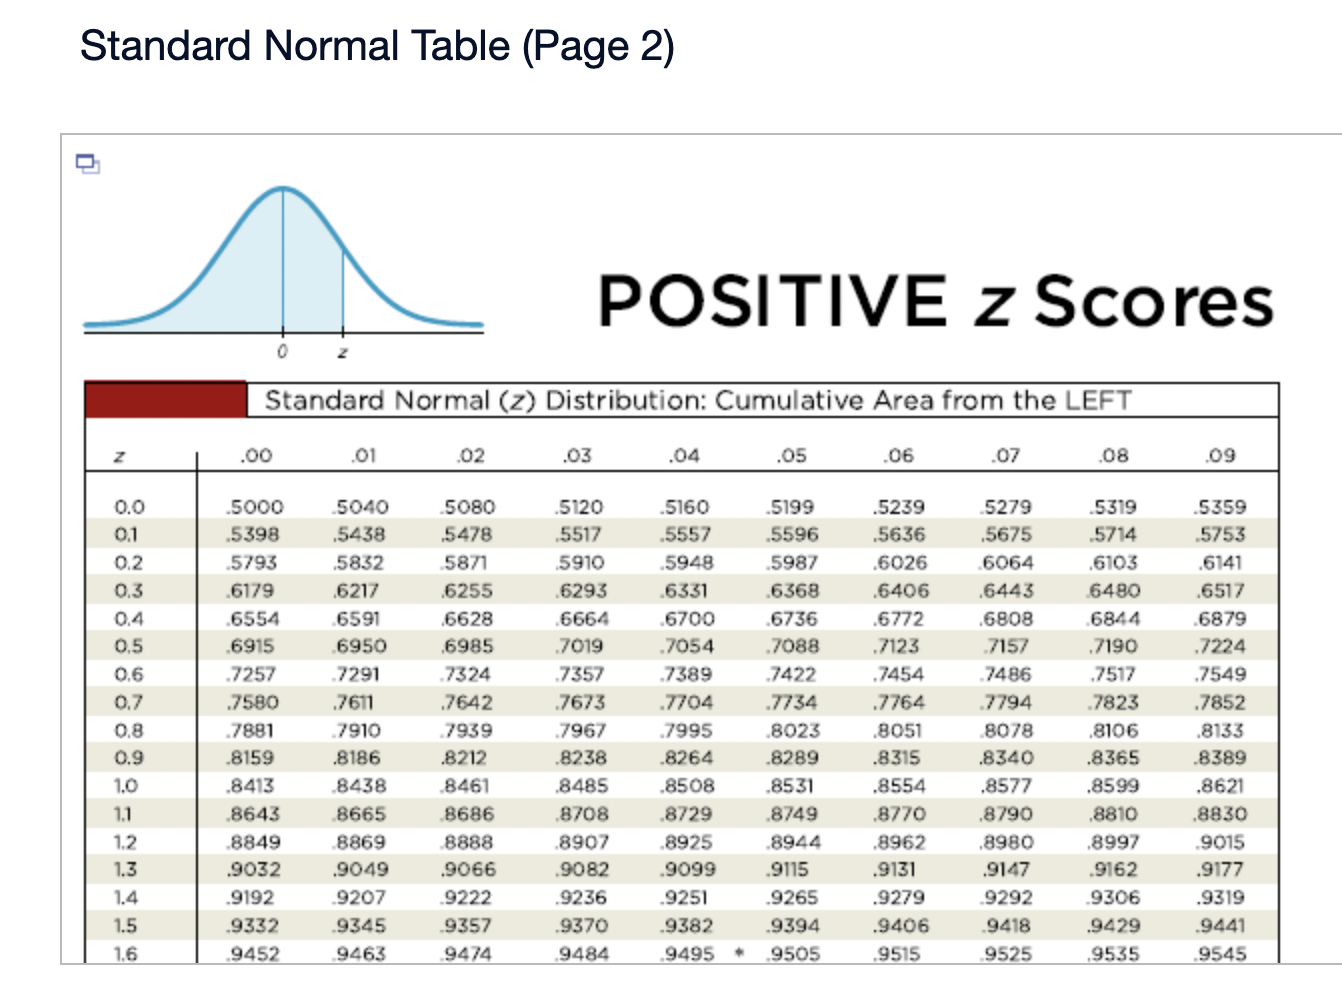
Assume that the Poisson distribution applies and that the mean number of hurricanes in a certain area is 6.2 per year. a. Find the probability that, in a year, there will be 5 hurricanes. b. in a 35-year period, how many years are expected to have 5 hurricanes? c. How does the result from part (b) compare to a recent period of 35 years in which 5 years had 5 hurricanes? Does the Poisson distribution work well here? a. The probability is El. (Round to three decimal places as needed.) b. The expected number of years with 5 hurricanes is D. (Round to one decimal place as needed.) c. The result from part (b) is the number of hurricanes in the recent period of 35 years, so the Poisson distribution appear to work well in the given situation. In a recent year, an author wrote 177 checks. Use the Poisson distribution to find the probability that, on a randomly selected day, he wrote at least one check. E> The probability is D. (Round to three decimal places as needed.) What requirements are necessary for a normal probability distribution to be a standard normal probability distribution? E) Choose the correct answer below. {:3 A. The mean and standard deviation have the values of u = 0 and 0 =1. The mean and standard deviation have the values of u = 0 and 0' = 0. The mean and standard deviation have the values of u = 1 and 0 =1. 9.0!\" The mean and standard deviation have the values of u = 'l and o = 0. Find the indicated critical value. Zo.03 Click to view page 1 of the table. Click to view page 2 of the table. Z0.03 (Round to two decimal places as needed.)Find the area of the shaded region. The graph depicts the standard normal distribution with mean 0 and standard deviation 1. Click to View [gage 1 of the table. Click to View page 2 of the table. 2 = 0.27 The area of the shaded region is D. (Round to four decimal places as needed.) Standard Normal Table (Page 1) NEGATIVE z Scores Standard Normal (z) Distribution: Cumulative Area from the LEFT .01 02 .03 .04 .05 06 .07 08 .09 -3.50 and lower 0001 -3.4 0003 .0003 0003 .0003 .0003 .0003 0003 .0003 .0003 .0002 -3.3 .0005 .0005 0005 .0004 .0004 .0004 0004 0004 .0004 .0003 -3.2 0007 .0007 0006 0006 .0006 .0006 0006 0005 .0005 .0005 -3.1 .0010 .0009 .0009 .0009 .0008 .0008 .0008 .0008 .0007 .0007 -3.0 0013 0013 .0013 .0012 .0012 .0011 .0011 .0011 .0010 .0010 -2.9 .0019 .0018 .0018 .0017 .0016 .0016 0015 0015 .0014 .0014 -2.8 .0026 .0025 .0024 .0023 .0023 .0022 .0021 .0021 .0020 .0019 -2.7 .0035 .0034 0033 0032 .0031 .0030 0029 .0028 .0027 .0026 -2.6 .0047 .0045 .0044 .0043 .0041 .0040 .0039 .0038 .0037 .0036 -2.5 .0062 .0060 0059 .0057 .0055 .0054 .0052 .0051 .0049 .0048 -2.4 .0082 .0080 0078 .0075 .0073 .0071 .0069 0068 .0066 .0064 -2.3 .0107 .0104 .0102 .0099 .0096 .0094 0091 .0089 .0087 .0084 -2.2 .0139 .0136 .0132 .0129 .0125 .0122 .0119 .0116 .0113 .0110 -2.1 .0179 0174 .0170 0166 .0162 .0158 0154 0150 .0146 .0143Standard Normal Table (Page 2) POSITIVE 2 Scores Standard Normal (2) Distribution: Cumulative Area from the LEFT 0.0 .5000 5040 5080 .5120 .5160 .5199 .5239 5279 .5319 .5359 0.1 .5398 .5438 .5478 .5517 .5557 .5596 .5536 .5675 .5714 .5753 0.2 .5 795 .5852 5871 5910 .5948 5987 .6026 6064 .6105 .6141 0.3 .6179 .6217 .6255 .6293 .6331 .6368 .6406 .6443 6480 .6517 0.4 6554 6591 .6628 6664 6700 6736 .6772 .6808 6844 6879 0.5 .6915 6950 .6985 .7019 .7054 .7088 .7123 7157 .7190 .7224 0.6 7257 7291 73 24 7357 7389 747? .7454 7486 .7517 .7549 0.7 .7580 .7611 .7642 .7673 .7704 .7734 .7764 .7794 .7823 .7852 0.8 .7881 7910 793 9 7967 .7995 802.5 .8051 8078 .8106 .8155 0.9 .8159 .8186 .8212 .8238 .8264 .8289 .8315 .8340 .8365 .8389 1.0 .8413 3438 8461 .8485 .8508 .8531 .8554 .8577 .8599 .8621 1.1 .8643 8665 8686 .8708 .8729 .8749 .8770 .8790 .8810 .8830 1.? 8849 8869 8888 8907 8925 8944 .8962 .8980 .8997 9015 1.3 .9032 .9049 .9066 .9082 .9099 .9115 .9131 .9147 .9162 .9177 1.4 .9192 9207 9222 .9236 .9251 .9265 .9279 9292 9306 .9319 1.5 .9332 .9345 .9357 .9370 .9382 .9394 .9406 .9418 .9429 .9441 1.6 9452 946.5 9474 9484 .9495 ' 9505 .9515 9525 .9535 9545 Find the indicated 2 score. The graph depicts the standard normal distribution with mean 0 and standard deviation 1. 0.2090 The indicated 2 score is D. (Round to two decimal places as needed.) Find the area of the shaded region. The graph to the right depicts IQ scores of adults, and those scores are normally distributed with a mean of 100 and a standard deviation of 15. Click to view [.398 1 of the table. Click to View {ge 2 of the table. 90 115 The area of the shaded region is D. (Round to four decimal places as needed.) Standard Normal Table (Page 1) NEGATIVE 2 Scores Standard Normal (2) Distribution: Cumulative Area from the LEFT .00 .01 02 .03 .04 .05 .06 .07 .08 .09 -3.50 and lower .0001 3 4 .0003 0003 0003 0003 0003 .0003 0003 .0003 0003 ,0002 -3.3 .0005 .0005 .0005 .0004 .0004 .0004 .0004 .0004 .0004 .0003 3 2 .000 I .000 I 0006 0006 0 006 .0006 0006 .0005 .0005 .0005 -31 .0010 .0009 0009 .0009 .0008 .0008 0008 .0008 .0007 .0007 5 0 .0015 .0013 0013 0012 .0012 .0011 0011 .0011 0010 .0010 -2.9 .0019 .0018 .0018 .0017 .0016 .0016 .0015 .0015 .0014 .0016 2.8 .0026 .0025 .0024 .0023 .0023 .0022 0021 .0021 .0020 .0019 -2.7 .0035 .0034 .0033 .0032 .0031 .0030 .0029 .0028 .002? .0026 2 6 .004 I .0045 0044 0045 .0 041 .004 0 0039 .0033 005 i .0036 -2.5 .0062 .0060 .0059 .0057 .0055 .0054 .0052 .0051 " .0049 .0048 2.4 .0082 .0080 .0008 .0075 .0 073 .0021 0-069 .0068 .0066 .0064 ~23 .0107 .0104 .0102 .0099 .0096 .0094 .0091 .0089 .0087 .0084 2.2 .0139 .0136 .0132 .0129 .0125 .0122 0119 .0116 .0113 .0110 '2} .0179 .0174 .0170 .0166 .0152 .0158 0154 .0150 .0146 .0143 Standard Normal Table (Page 2) POSITIVE 2 Scores Standard Normal (2) Distribution: Cumulative Area from the LEFT .00 .01 .02 .03 .04 .05 .06 .07 .08 .09 0.0 .5000 5040 5080 .5120 .5160 .5199 .5239 5279 .5319 .5359 0.1 .5398 .5438 .5478 .5517 .5557 .5596 .5636 .5675 .5714 .5753 0.2 579.5 .5832 5871 5910 5948 5981' .6026 6064 .6105 .6141 0.3 .6179 .6217 .6255 .6293 .6331 .6368 .6406 .6443 6480 .6517 0.4 6554 6591 .6628 6664 .6700 .6736 .6772 .6808 6844 .6879 0.5 .6915 6950 .6985 .7019 .7054 .7088 .7123 7157 .7190 .7224 0.6 7257 7791 7324 7357 7389 74?? .7454 7486 .7517 .7549 0.7 .7580 .7611 .7642 .7673 .7704 .7734 .7764- 7794 7823 .7852 0.8 78-81 7910 7939 7967 .7995 8023 .8051 80/8 .8106 .8155 0.9 .8159 .8186 .8212 .8238 .8264 .8289 .8315 .8340 .8365 .8389 1.0 .8413 8438 8461 .8485 .8508 .8531 .8554 .8577 .8599 .8621 1.1 .8643 8665 8686 .8708 .8729 .8749 .8770 .8790 .8810 .8830 1.7 8849 8869 8888 8907 .8925 .8944 .8962 .8980 .8997 .9015 1.3 .9032 .9049 .9066 .9082 .9099 .9115 .9131 .9147 .9162 .9177 1.4 .9192 9207 9222 .9236 .9251 .9265 .9279 9292 9306 .9319 1.5 .9332 .9345 .9357 .9370 .9382 .9394 .9406 .9418 .9429 .9441 1.6 9452 9463 94/4 9484 .9495 .9505 .9515 9525 .9535 .9545 The weights of the chocolate in Hershey Kisses are normally distributed with a mean of4.5338 g and a standard deviation of 0.1039 Q. Is the distribution a standard normal distribution? Why or why not? E) Is the distribution a standard normal distribution? Why or why not? Choose the correct answer. {:1} A. Yes, because standard normal distributions can have different means and standard deviations. if} B. Yes, because every normal distribution is also a standard normal distribution. The terms are interchangeable. {:1- C. No, because it has not been converted to a normal distribution yet. {:1- D. No, because a standard normal distribution has a mean of 0 and a standard deviation of 1. Engineers want to design seats in commercial aircraft so that they are wide enough to fit 95% of all males. (Accommodating 100% of males would require very wide seats that would be much too expensive.) Men have hip breadths that are normally distributed with a mean of 14.3 in. and a standard deviation of 0.9 in. Find P95. That is, nd the hip breadth for men that separates the smallest 95% from the largest 5%. (E The hip breadth for men that separates the smallest 95% from the largest 5% is P95 = D in. (Round to one decimal place as needed.) Which of the following is NOT a requirement of the Poisson Distribution? (E Choose the correct answer below. if} A. The random variable x is the number of occurrences of an event over some interval. The occurrences must be random. The occurrences must be dependent. POP\" The occurrences must be uniformly distributed over the interval being used. Standard Normal Table (Page 1) NEGATIVE 2 Scores Standard Normal (2) Distribution: Cumulative Area from the LEFT .00 .01 02 .03 .04 .05 .06 .0? .08 .09 -3 50 and lower .0001 3 4 .0003 0003 0003 0003 0 003 .0003 0003 .0003 0003 .0002 -3.3 .0005 .0005 .0005 .0004 .0004 .0004 0004 .0004 .0004 .0003 3 2 .0001J 000! 0006 0006 0006 .0006 0006 .0005 .0005 .0005 \"-31 .0010 0009 0009 0009 0006 .0003 0008 .0003 00011' .0007 5 0 .0013 0013 0013 0019 .0 01? .0011 0011 .0011 0010 .0010 *29 .0019 .0018 .0018 .0019 .0016 .0016 0015 .0015 .0014 .0014 9.8 .0096 .0095 .0094 .0093 .0 093 .0099 0091 .0091 .0090 .0019 -2.7 .0035 .0034 .0033 .0032 .0031 .0030 0099 .0098 .0097 .0026 2 6 .004} 0045 0044 004.5 0041 .0040 00.59 .0038 00.5.1I .0036 ~2.5 .0062 .0060 .0059 .0057 .0055 .0054 0052 .0051 " .0049 .0048 2.4 .0082 .0080 .0098 .0075 .0 073 .0071 0069 .0068 .0066 .0064 *2.3 .0107 .0104 .0102 .0099 .0096 .0094 0091 .0089 .0087 .0084 9.9 .0139 .0136 .0139 .0199 .0195 .0199 0119 .0116 .0113 .0110 -2.1 .0179 .0174 .0170 .0166 .0162 .0158 0154 .0150 .0146 .0143 Standard Normal Table (Page 2) POSITIVE 2 Scores Standard Normal (2) Distribution: Cumulative Area from the LEFT .00 .01 .02 .03 .04 .05 .06 .07 .08 .09 0.0 .5000 5040 5080 .5120 .5160 .5199 .5239 5279 .5319 .5359 0.1 .5398 .5438 .5478 .551? .5557 .5596 .5636 .5675 .5714 .5753 0.2 .51'93 .5852 58.71 5910 5948 5984' .6026 6064 .6105 .6141 0.3 .6179 .6217 .6255 .6293 .6331 .6368 .6406 .6443 6480 .651 ? 0.4 6554 6591 .6628 66:54 6700 6736 .6772 .6808 6844 6829 0.5 .6915 6950 .6985 3019 .7054 .7088 .7123 7157 .7190 .2224 0.6 .2757 7791 73 24 2357 7389 .747? .7454 7486 .7517 .7549 0.? .7580 .7611 .7642 .?673 .1704 .7734 .7764 7294 .7823 .7852 0.8 1881 I910 193 9 1'96! I995 802.5 .8051 8018 .8106 .8155 0.9 .8159 .8186 .8212 .8238 .8264 .8289 .8315 .8340 .8365 .8389 1.0 .8413 843 B 8461 .8435 .8508 .8531 .8554 .8577 .8599 .8621 1.1 .8643 8665 8686 .8708 .8729 .8749 .8?70 .8 290 .8810 .8830 1.? .8849 8869 8888 890 7 8925 .8944 .896? .8980 .899? 9015 1.3 .9032 .9049 .9066 .9082 .9099 .9115 .9131 .9147 .9162 .9177 1.4 .9192 920? 9222 .92 36 .9251 .9265 .9279 9292 9306 .9319 1.5 .9332 .9345 .9357 .9370 .9382 .9394 .9406 .9418 .9429 .9441 1.6 .9452 9465 94 )4 9484 9495 ' .9505 .9515 9525 .9535 9545
Step by Step Solution
There are 3 Steps involved in it

Get step-by-step solutions from verified subject matter experts