

Question: This is for the Jeans Simulation. Please help me answer and explain the following questions based on the charts provided. 1. Explain the reasons behind
This is for the Jeans Simulation. Please help me answer and explain the following questions based on the charts provided.
1. Explain the reasons behind the highs and lows, successes, and weak points in these charts. Why did these occur?
2. What did you do well?
3. What accounts for the weaknesses and what could you have done better?
4. What would you change in the future?
5. How did external factors such as competition and news bulletins affect your outcomes? (Please see attached photos for the charts)
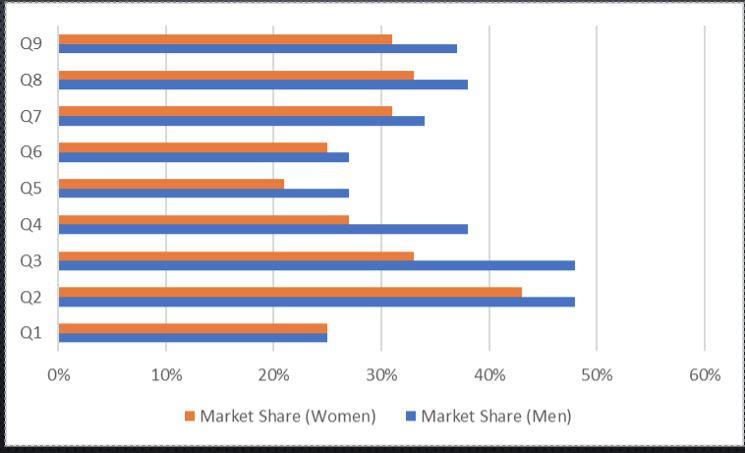
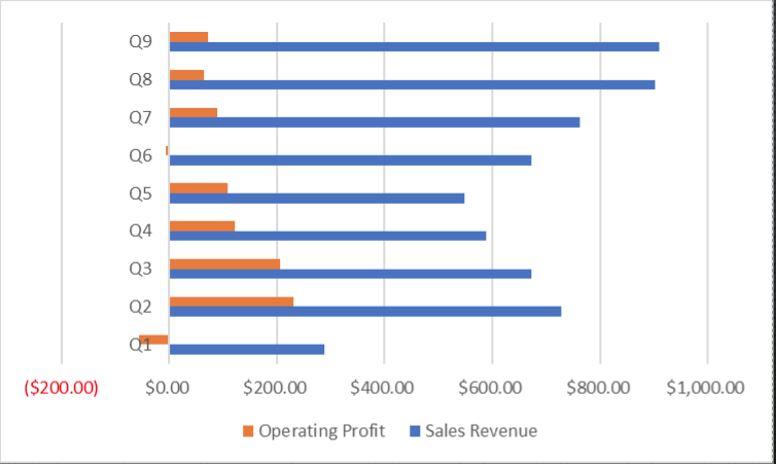
Q9 Q8 Q7 Q6 Q5 Q4 Q3 Q2 Q1 0% 10% 20% 30% 40% 50% 60% Market Share (Women) Market Share (Men) Q9 Q8 Q7 Q6 Q5 Q4 Q3 Q2 ($200.00) $0.00 $200.00 $400.00 $600.00 $800.00 $1,000.00 Operating Profit Sales Revenue Q9 Q8 Q7 Q6 Q5 Q4 Q3 Q2 Q1 0% 10% 20% 30% 40% 50% 60% Market Share (Women) Market Share (Men) Q9 Q8 Q7 Q6 Q5 Q4 Q3 Q2 ($200.00) $0.00 $200.00 $400.00 $600.00 $800.00 $1,000.00 Operating Profit Sales Revenue
Step by Step Solution
There are 3 Steps involved in it

Get step-by-step solutions from verified subject matter experts