

Question: This is for the RiskReturn Project. The data file Beta Calculation Spreadsheet can be found in the Ch. 7 module. Then follow the procedures below.
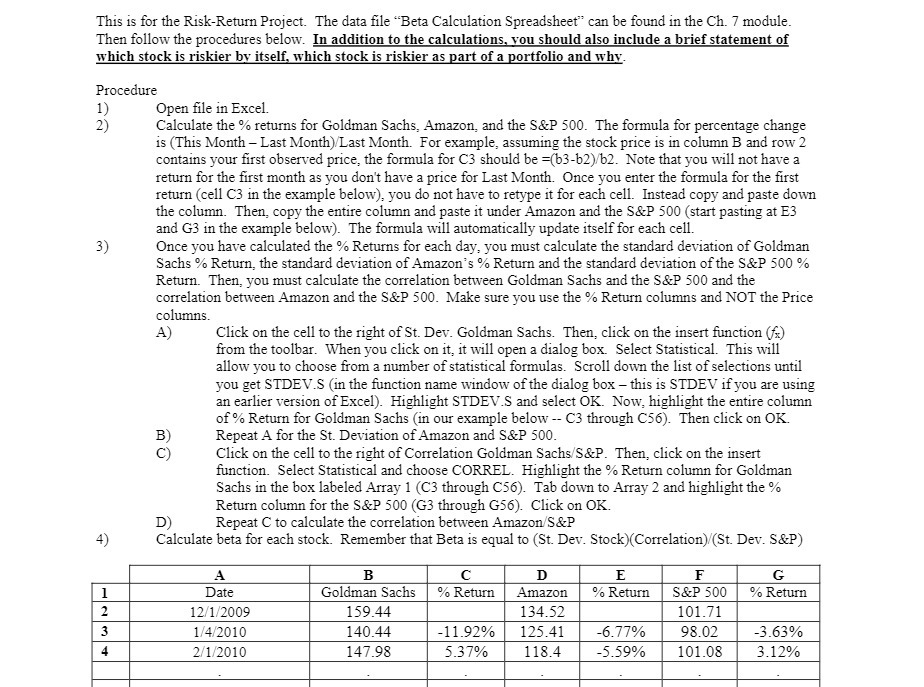
This is for the RiskReturn Project. The data file \"Beta Calculation Spreadsheet" can be found in the Ch. 7" module. Then follow the procedures below. In addition to the calculations you should also include a brief statement of which stock is riskier by itseli'I which stock is riskier as part of a mrtfolio and why. Procedure 1) Open le in Excel. 2) Calculate the '34; returns for Goldman Sachs, Amazon and the 33.2? 500. The formula for percentage change is (This Month Last Monda).-'Last Month. For example, assuming the stock price is in column B and row 2 contains your rst observed price, the formula for C3 should be =(b3b2).-'b2. Note that you will not have a return for the rst month as you don't have a price for Last Month. Once you enter the formula for the rst return (cell C3 in the example below), you do not have to retype it for each cell. Instead copy and paste down the column. Then, copy the entire column and paste it under Amazon and the 53:? 500 (start pasting at E3 and G3 in the example below). The formula will automatically update itselffor each cell. 3) Once you have calculated the '34 Returns for each day, you must calculate the standard desiation of Goldman Sachs 9;, Return, the standard deviation of Amazon" 5 \"fa Return and the standard deviation of the S&P 500 91': Return. Then, you must calculate the correlation between Goldman Sachs and the S&P 500 and the correlation between Amazon and the S851? 500. Make sure you use % Return columns and NOT the Price columns. A) Click on the cell to the right of St. Dev. Goldman Sachs. Then, click on the insert function (5;) om the toolbar. When you click on it, it will open a dialog box. Select Statistical. This will allow you to choose om a number of statistical formulas. Scroll down the list of selections until you get STDEVS (in. the inction name window of the dialog box this is STDE't-r if you are using an earlier version of Excel}. Highlight S] } \"US and select OK. Now: highlight the entire column of \"xi: Return for Goldman Sachs (in our example belot ' C3 through C55). Then click on OK B) Repeat A for the St. Deviation of Amazon and S&P 500. C) Click on the Dell to the right of Correlation Goldman Sachs-"8&3 Then, click on the insert function. Select Statistical and choose CORREL. Highlight the '31.\"; Return column for Goldman Sachs in the box labeled Array 1 (C3 through C56). Tab down to Array 2 and highlight the % Return column for the S&P 500 (C3 through G56). Click on OK. D) Repeat C to calculate the correlation between Amazon-"SELF 4) Calculate beta for each stock. Remember that Beta is equal to (St. Dev. Stock}(Correlation).-"(St Dev. 3&P) A E F C Date \"xi: Return S&P 500 % Return 13152009 101.?1 1.-"4;'2010 41.92% 125 .41 45.77% 98.02 -3 .63% 2.5112010 5.3T% 113.4 6.59% 101.08 3.12%
Step by Step Solution
There are 3 Steps involved in it

Get step-by-step solutions from verified subject matter experts