

Question: this is from my business data analytics graph, I'm having difficulty putting this together!!! Exactly how am I suppose to do this? I need a
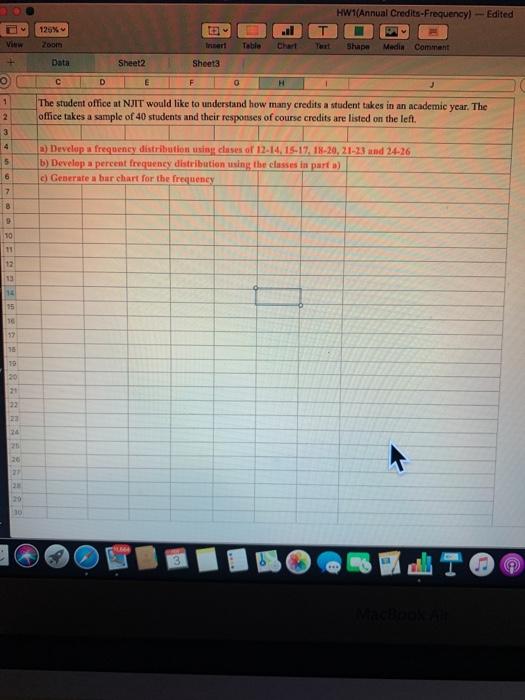
HW 1(Annual Credits-Frequency) -Edited 125% T Vi Zoom Table Shape Media Comment + Data Sheet2 Sheet3 D E F 0 H 1 The student office at NJIT would like to understand how many credits a student takes in an academic year. The office takes a sample of 40 students and their responses of course credits are listed on the left 3 5 6 Develop a frequency distribution using cases of 12-14, 15.17. 18-20,21-23 and 24-26 b) Develop a percent frequency distribution using the classes in part) d Generate a burchart for the frequency 7 8 10 11 12 13 1 10 20 36 HW 1(Annual Credits-Frequency) -Edited 125% T Vi Zoom Table Shape Media Comment + Data Sheet2 Sheet3 D E F 0 H 1 The student office at NJIT would like to understand how many credits a student takes in an academic year. The office takes a sample of 40 students and their responses of course credits are listed on the left 3 5 6 Develop a frequency distribution using cases of 12-14, 15.17. 18-20,21-23 and 24-26 b) Develop a percent frequency distribution using the classes in part) d Generate a burchart for the frequency 7 8 10 11 12 13 1 10 20 36
Step by Step Solution
There are 3 Steps involved in it

Get step-by-step solutions from verified subject matter experts