

Question: this is full question Chapter 8 Problem Bartman Industries's and Reynolds Inc.'s stock prices and dividends, along with the Winslow 5000 Index, are shown here
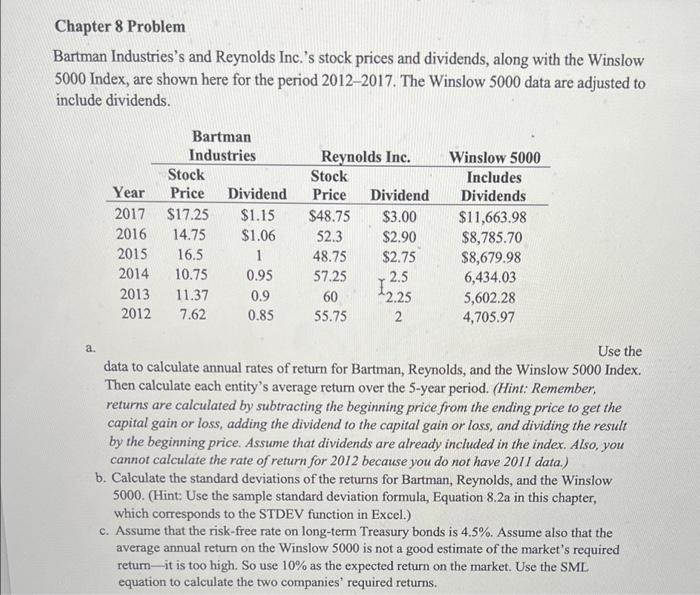
Chapter 8 Problem Bartman Industries's and Reynolds Inc.'s stock prices and dividends, along with the Winslow 5000 Index, are shown here for the period 2012-2017. The Winslow 5000 data are adjusted to include dividends. a. Use the data to calculate annual rates of return for Bartman, Reynolds, and the Winslow 5000 Index. Then calculate each entity's average retum over the 5-year period. (Hint: Remember, returns are calculated by subtracting the beginning price from the ending price to get the capital gain or loss, adding the dividend to the capital gain or loss, and dividing the result by the beginning price. Assume that dividends are already included in the index. Also, you cannot calculate the rate of return for 2012 because you do not have 2011 data.) b. Calculate the standard deviations of the returns for Bartman, Reynolds, and the Winslow 5000. (Hint: Use the sample standard deviation formula, Equation 8.2a in this chapter, which corresponds to the STDEV function in Excel.) c. Assume that the risk-free rate on long-term Treasury bonds is 4.5%. Assume also that the average annual retum on the Winslow 5000 is not a good estimate of the market's required return - it is too high. So use 10% as the expected return on the market. Use the SML equation to calculate the two companies' required returns
Step by Step Solution
There are 3 Steps involved in it

Get step-by-step solutions from verified subject matter experts