

Question: this is google colab. please help Problem 8 1) Create a new code cell below. 2) Create some x data which contains at least five
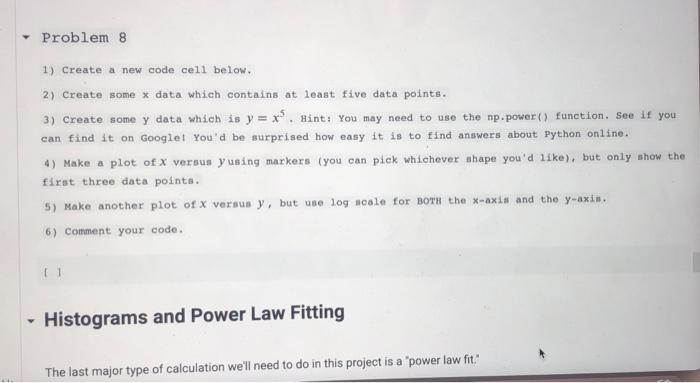
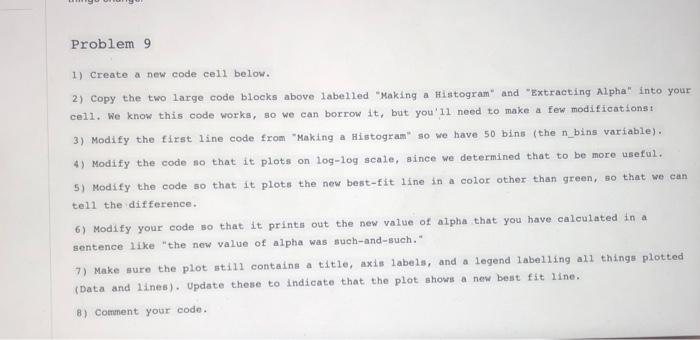
Problem 8 1) Create a new code cell below. 2) Create some x data which contains at least five data points. 3) Create some y data which is y = x'. Hint: You may need to use the np.power() function. See if you can find it on Google! You'd be surprised how easy it is to find answers about Python online. 4) Make a plot of X versus yusing markers (you can pick whichever shape you'd like), but only show the first three data points. 5) Make another plot of X versus y, but use log scale for BOTH the x-axis and the y-axis. 6) Comment your code. V Histograms and Power Law Fitting The last major type of calculation we'll need to do in this project is a "power law fit." Problem 9 1) Create a new code cell below. 2) Copy the two large code blocks above labelled "Making a Histogram" and "Extracting Alpha" into your cell. We know this code works, so we can borrow it, but you'll need to make a few modifications: 3) Modify the first line code from Making a Histogram" so we have 50 bins (the n_bins variable). 4) Modify the code so that it plots on log-log scale, since we determined that to be more useful. 5) Modify the code so that it plots the new best-fit line in a color other than green, so that we can tell the difference. 6) Modify your code so that it prints out the new value of alpha that you have calculated in a sentence like "the new value of alpha was such-and-such." 7) Make sure the plot still contains a title, axis labels, and a legend labelling all things plotted (Data and lines). Update these to indicate that the plot shows a new best fit line. 8) Comment your code Problem 10 1) Create a new text cell below and give the final value as you computed it. Describe the diff between your plot with 50 bins verus the one above with 10. Which do you think is better for ti the data, and why? Congratulations! You completed the coding packet! This covers the majority of the skills we'll be using in our solar flare research proj you see these topics come up again in the future, we encourage you to refer back to this and copy/modify code as possible! You've also gotten a little taste of what it means for data to follow a "power law," and how to quantify that power lav- determining the exponent a We did that in the context of crater size, and now, we can turn our attention to doing th for solar flare energy. This will take a lot more work-among other things, we don't actually know the true energy of yet, and that alone will be tricky to calculate. But once the whole class has finished analyzing the energy of the sola our dataset, we'll put them together and do something very similar to what we've done here! lable
Step by Step Solution
There are 3 Steps involved in it

Get step-by-step solutions from verified subject matter experts