

Question: This is Horizontal Analysis - Trend Analysis. I need a detailed analysis to write a report. This is Horizontal Analysis - Trend Analysis. I need
This is Horizontal Analysis - Trend Analysis. I need a detailed analysis to write a report.
This is Horizontal Analysis - Trend Analysis. I need a detailed analysis to write a report.
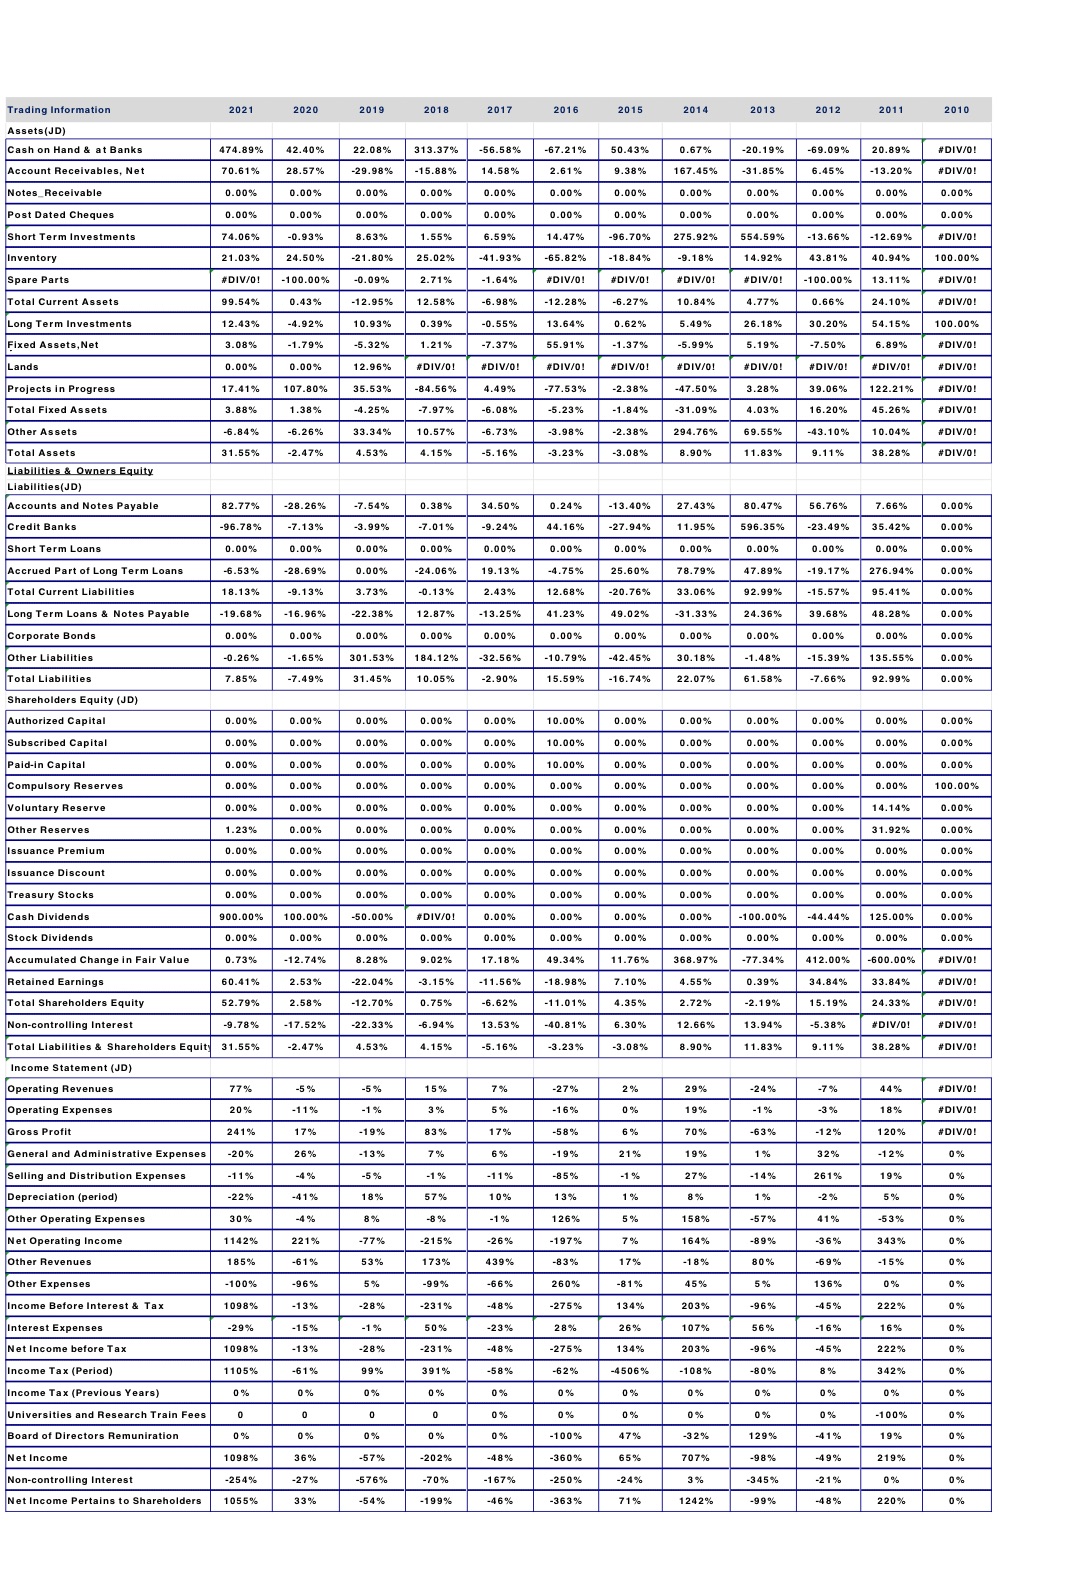 Trading Information 2021 2020 2019 2018 2017 2016 2015 Assets (JD 2014 2013 2012 2011 2010 Cash on Hand & at Banks 474.89% 42.40% 22.08% 313.37% -56.58% -67.21% Account Receivables, Net 50.43% 0.67% 70.61% -20.19% 28.57% -69.09% -29.98% 20.89% -15.88% #DIV/O! 14.58% 2.61% Notes_Receivable 9.38%% 167.45% -31.85% 0.00% 6.45% 0.00% -13.20% 0.00% 0.00% #DIV/O 0.00% 0.00% 0.00% 0.00% Post Dated Cheques 0.00% 0.00% 0.00% 0.00% 0.00% 0.00% 0.00% 0.00% 0.00% 0.00% 0.00% 0.00% Short Term Investments 0.00% 0.00% 74.06% -0.939 0.00% 8.63% 0.00% 1.55% 6.59% 14.47% Inventory -96.70% 275.92% 554.59% -13.66% 21.03% 24.50% -12.69% 21.80% #DIV/O! 25.02% -41.93% -65.82% Spare Parts -18.84% -9.18% 14.92% #DIV/O! 43.81% 40.94% -100.00% -0.09% 2.71% 100.00% 1.64% #DIV/O! Total Current Assets #DIV/O! #DIV/O! #DIV/O! 99.54% -100.00% 0.43% 13.11% -12.95% 12.58% DIV/O! -6.98% -12.28% 6.27% Long Term Investments 10.84% 4.77% 12.43% 0.66% -4.92 10.93% 24.10% #DIV/O! 0.39% -0.55% Fixed Assets, Net 13.64% 0.62% 5.49% 3.08% 26.18% 30.20% -1.79 -5.32% 54.15% 1.21% 100.00% -7.37% $5.91% Land -1.37% -5.99% 5.19% 0.00% -7.50% 0.00% 12.96% 5.89% #DIV/O! "DIV/O! #DIV/O! #DIV/0! #DIV/O! #DIV/O! Projects in Progress 17.41% #DIV/O! #DIV/O! 107.80% 35.53% #DIV/O! -84.56% #DIV/O! 4.49% -77.53% Total Fixed Assets -2.38% -47.50% 3.28% 3.88% 39.06% 1.38% -4.25% 122.21% #DIV/O! -7.97% -6.08% -5.23% Other Assets -1.84% 6.84% -31.09% 4.03% 16.20% -6.26% 33.34% 45.26% 10.57% #DIV/0! -6.73% -3.98% Total Assets -2.38% 294.76% 31.55% 69.55% -43.10% -2.47% 10.04% 4.53% #DIV/O! 4.15% Liabilities & Owners Equity -5.16% -3.23% -3.08% 8.90% 11.83% 9.11% 38.28% #DIV/0! Liabilities(JD) Accounts and Notes Payable 82.77% -28.26% -7.54% 0.38% 34.50% 0.24% Credit Banks -13.40% 27.43% -96.78% 80.47% 56.76% 7.66% -7.13 -3.99% 0.00% 7.01% -9.24% 14.16% Short Term Loans -27.94% 1 1.95% 596.35% 0.00% -23.49% 0.00% 35.42% 0.00% 0.00% 0.00% 0.00% 0.00% 0.00% 0.00% Accrued Part of Long Term Loans 0.00% 6.53% 0.00% 28.69% 0.00% .00% -24.06% 0.00% 19.13% Total Current Liabilities 4.75% 18.13% 25.60% 78.79% 47.89% -9.139 3.73% -19.17% 276.94% -0.13% 2.43% 0.00% 12.68% Long Term Loans & Notes Payable -20.76% 33.06% -19.68% 92.99% -15.57% -16.96% -22.38% 95.41% 0.00% 12.87% -13.25% 41.23% 49.02% Corporate Bonds -31.33% 24.36% 39.68% 0.00% 48.28% 0.00% 0.00% 0.00% 0.00% 0.00% 0.00% 0.00 Other Liabilities -0.26% 0.00% 0.00% 0.00% -1.65% 0.00% 301.53% 0.00% 184.12% -32.56% -10.79% Total Liabilities -42.45% 30.18% -1.48% 7.85% -15.39% -7.49% 135.55% 31.45% 0.00% 10.05% -2.90% 15.59% Shareholders Equity (JD) -16.74% 22.07% 61.58% -7.66% 92.99% 0.00% Authorized Capital 0.00% 0.00% 0.00% 0.00% 0.00% 10.00% 0.00% Subscribed Capital 0.00% 0.00% 0.00% 0.00% .00% 0.00% .00% 0.00% 0.00% 0.00% 10.00% Paid-in Capital 1.00% .00% .00% 0.00% 0.00% 0.00% 0.00% D.00% 0.00% 0.00% 0.00% 10.00% Compulsory Reserves 1.00% 0.00% 0.00% 0.00% 0.00% 0.00% 0.00% 0.00% 0.00% 0.00% 0.00% 0.00% 0.00% Voluntary Reserve 0.00% 0.00% 0.00% 0.00% 0.00% 0.00% 0.00% 100.00% 0.00% 0.00% 0.00% 0.00% Other Reserves 0.00% 0.00% 1.23% 0.00% 0.00%% .00% 14.14% 0.00% 0.00% 0.00% 0.00% Issuance Premium 0.00% 0.00% 0.00% 0.00% 0.00% 0.00% 0.00% 31.92% 0.00% 0.00% 0.00% 0.00% Issuance Discount 0.00% 0.00% 0.00% 0.00% 0.00 0.00% 0.00% 0.00% 0.00% 0.00% 0.00% 0.00% Treasury Stocks 0.00% 0.00% 0.00% 0.00 0.00% 0.00% 0.00% 0.00% 0.00% 0.00% 0.00% 0.00% Cash Dividends 0.00% 0.00% 900.00% 0.00% 0.00 100.00% 0.00% -50.00% 0.00% #DIV/O! 0.00% 0.00% Stock Dividends .00% 0.00% -100.00% 0.00% 0.00% -44.44% 125.00% 0.00% 0.00% 0.00% 0.00% 0.00% 0.00% 0.00% Accumulated Change in Fair Value 0.00% 0.00% 0.73% -12.74% 0.00% 8.28% 0.00% 9.02% 17.18% 49.34% 11.76% Retained Earnings 368.97% -77.34% 60.41% 412.00% -600.00% 2.53%% -22.04% #DIV/O! -3.15% 11.56% Total Shareholders Equity -18.98% 7.10% 4.55% 52.79% 0.39% 2.58%% 34.84% -12.70% 33.84% #DIV/O! 0.75% -6.62% -11.01% 1.35% Non-controlling Interest 2.72% -2.19% -9.78% 15.19% 24.33% -17.52% -22.33% #DIV/O! -6.94% 13.53% -40.81% 6.30% 12.66% Total Liabilities & Shareholders Equity 13.94% -5.38% 31.55% #DIV/O! -2.47% 4.53% #DIV/O! 4.15% -5.16% -3.23% -3.08% Income Statement (JD 8.90% 11.83% 9.11% 38.28% #DIV/O! Operating Revenues 77% -5% -5% 15% 7% -27% Operating Expenses 2% 29% -24% 20% -11% -7% 44% -1% #DIV/O! 5% Gross Profit -16% 0% 19% -1% 241% -3% 18% 17% -19% #DIV/O! 83% 17% -58% 6% 70% General and Administrative Expenses -63% -12% 120% -20% #DIV/O! 26% -13% 6% -19% Selling and Distribution Expenses 21% 19% 1% -4% 32% -11% -12% -5% -1% -11% -85% -1% Depreciation (period) 27% -14% -22% -41% 261% 18% 19% 57% 0% 10% 13% 1% 8% Other Operating Expenses 1% 30% -2% -4% 5% 8% 0% -8% -1% 126% Net Operating Income 5% 158% -57% 1142% 41% 221% -53% -77% 0% -215% -26% Other Revenues -197% 7% 164% -89% 185% -36% -61% 343% 53% 0% 173% 439% -83% 17% Other Expenses -18% 80% -100% -69% -96% -15% 5% 0% -99% -66% 260% 81% 45% Income Before Interest & Tax 5% 1098% 136% -28% 0% -231% 0% -48% -275% 134% Interest Expenses 203% -96% -29% -15% -45% - 1 % 222% 50% -23% 0% 28% 26% Net Income before Tax 107% 56% 1098% -16% -13% 16% -28% -23 1% 0% -48% 275% 134% Income Tax (Period) 203% -96% 1 105% -45% 61% 222% 39% 0 % 391% 58% 62% 4506% Income Tax (Previous Years) -108% -80% 0% 8% 342% 0% 0% 0% 0% 0% Universities and Research Train Fees 0% 0% 0% 0% 0% 0% Board of Directors Remuniratio 0% 0% 0% 0% 0% 0% 0% -100% 0% 0% 0% -100% 47% Net Income -32% 1098% 129% -41% 19% 36% -202% 0% -360% 65% Non-controlling Interest 707% -98% -254% -49% -27% 219% -576% 0% -70% -1 67%% -250% -24% Net Income Pertains to Shareholders 3% -345% 1055% -21% 33% 0% -54% -199% 0% -46% -363% 71% 1242% -99% -48% 220% 0%
 Step by Step Solution
There are 3 Steps involved in it
1 Expert Approved Answer
Step: 1 Unlock

Question Has Been Solved by an Expert!
Get step-by-step solutions from verified subject matter experts
Step: 2 Unlock
Step: 3 Unlock