

Question: This is in Matlab 2 Create a file called experiments.dat as fo 103 62 59 54 51 45 38 30 34 40 45 47 56
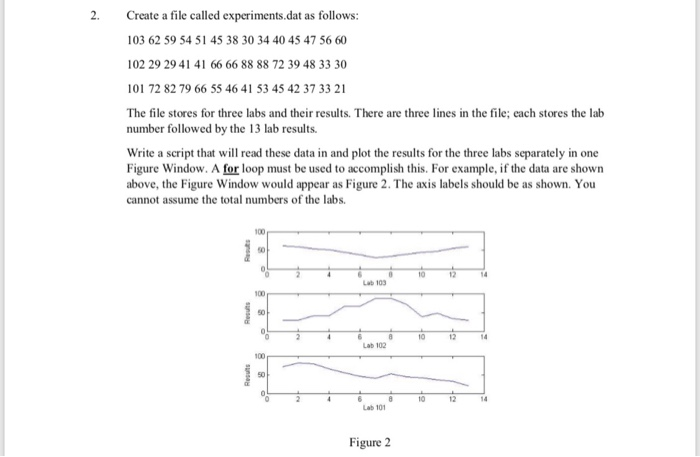
2 Create a file called experiments.dat as fo 103 62 59 54 51 45 38 30 34 40 45 47 56 60 102 29 29 41 41 66 66 88 88 72 39 48 33 30 101 72 82 79 66 55 46 41 53 45 42 37 33 21 The file stores for three labs and their results. There are three lines in the file; cach stores the lab number followed by the 13 lab results. Write a script that will read these data in and plot the results for the three labs separately in one Figure Window. A for loop must be used to accomplish this. For example, if the data are shown above, the Figure Window would appear as Figure 2. The axis labels should be as shown. You cannot assume the total numbers of the labs 100 14 Lab 103 100 10 14 Lab 102 100 50 10 12 14 Lab 10 Figure 2
Step by Step Solution
There are 3 Steps involved in it

Get step-by-step solutions from verified subject matter experts