

Question: this is in micro 7. The graph below shows the long run average total cost curve for your perfectly competitive rm. $ MC LRATC $15
this is in micro
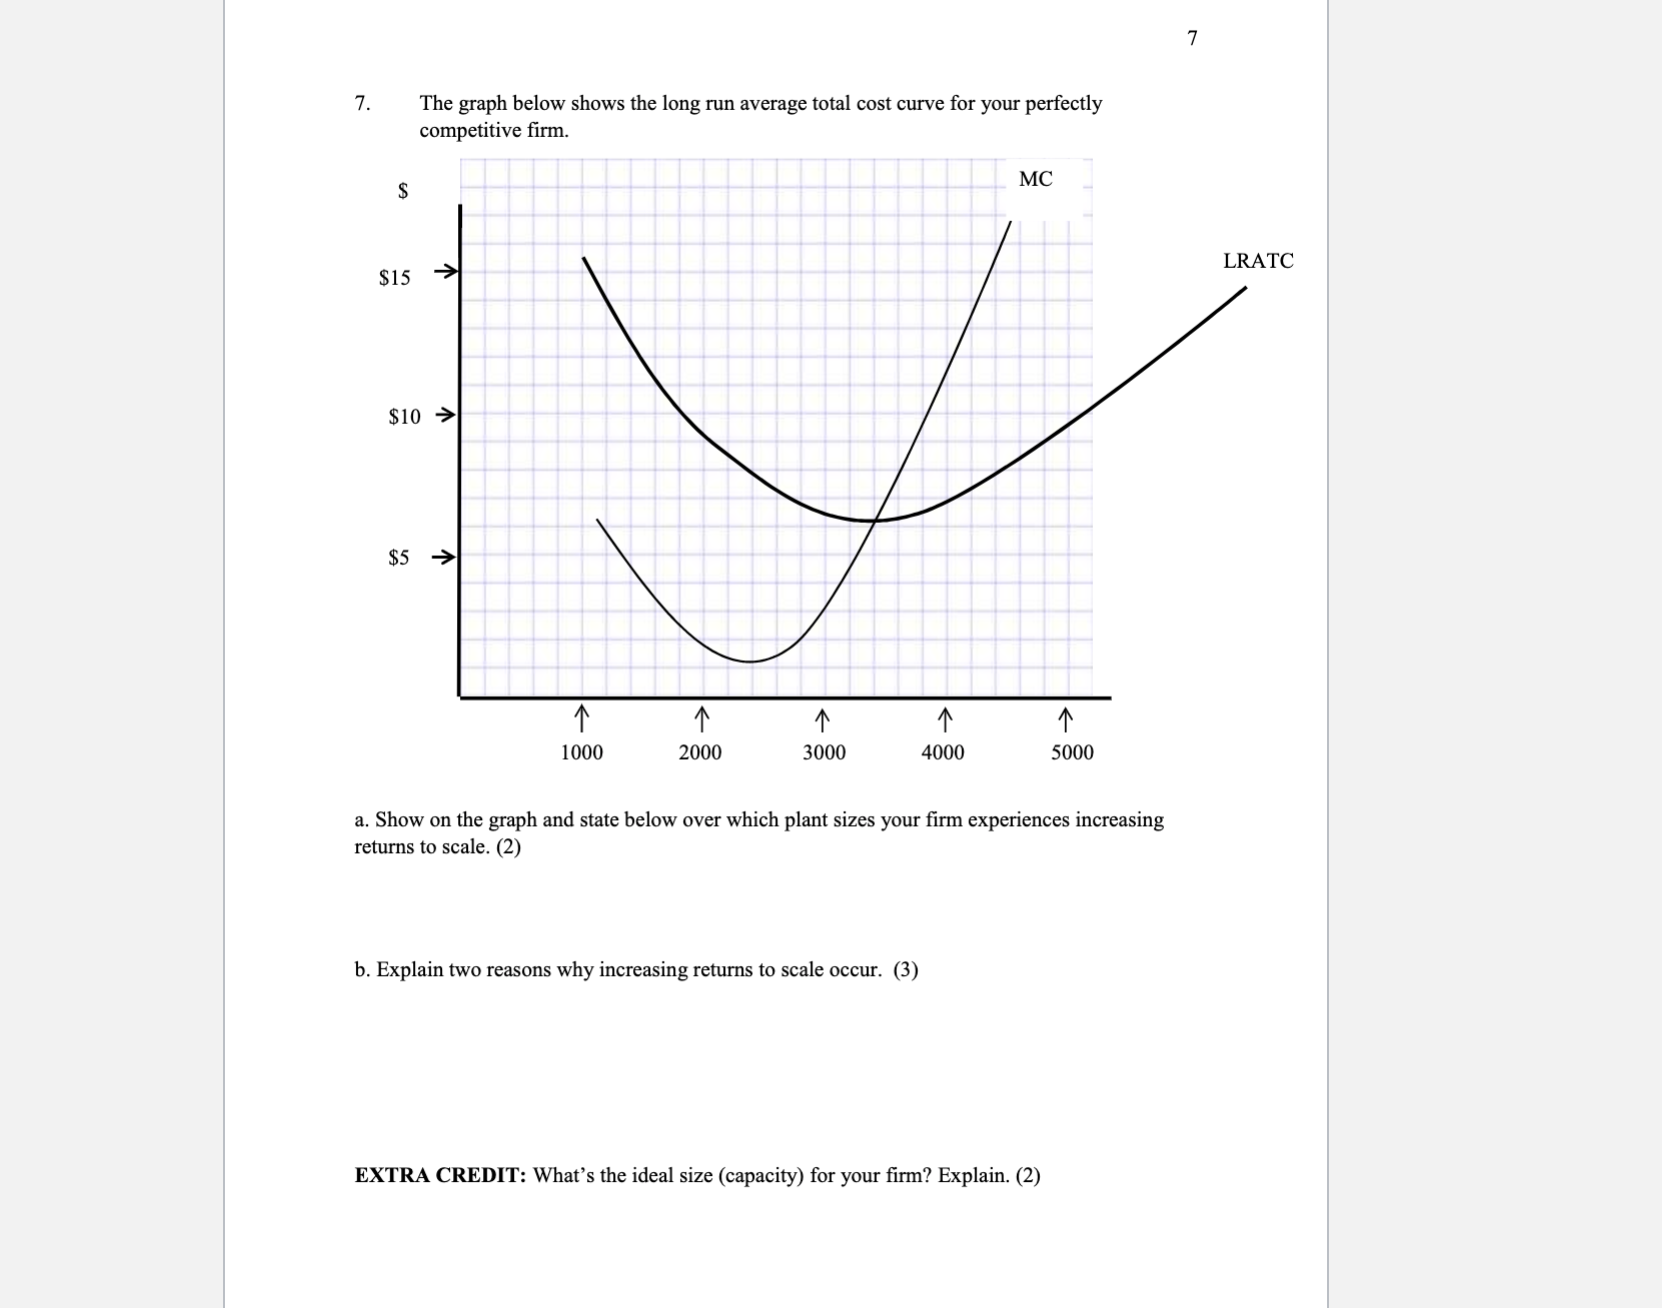
7. The graph below shows the long run average total cost curve for your perfectly competitive rm. $ MC LRATC $15 $10 9 $5 -) 1' 'l' 'l' 'l' '1' 1000 2000 3000 4000 5000 a. Show on the graph and state below over which plant sizes your rm experiences increasing returns to scale (2) b. Explain two reasons why increasing returns to scale occur. (3) EXTRA CREDIT: What's the ideal size (capacity) for your rm? Explain. (2)
Step by Step Solution
There are 3 Steps involved in it
1 Expert Approved Answer
Step: 1 Unlock

Question Has Been Solved by an Expert!
Get step-by-step solutions from verified subject matter experts
Step: 2 Unlock
Step: 3 Unlock