

Question: This is matlab. Can you do it and send me codes thanks. ENGIN 77 Lab #s Part 1: plotting As a class we will create
This is matlab. Can you do it and send me codes thanks.
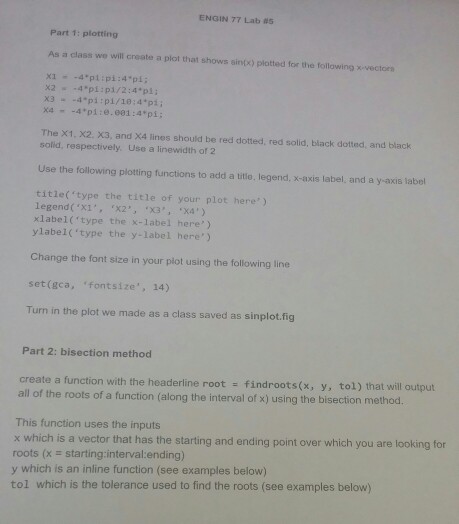
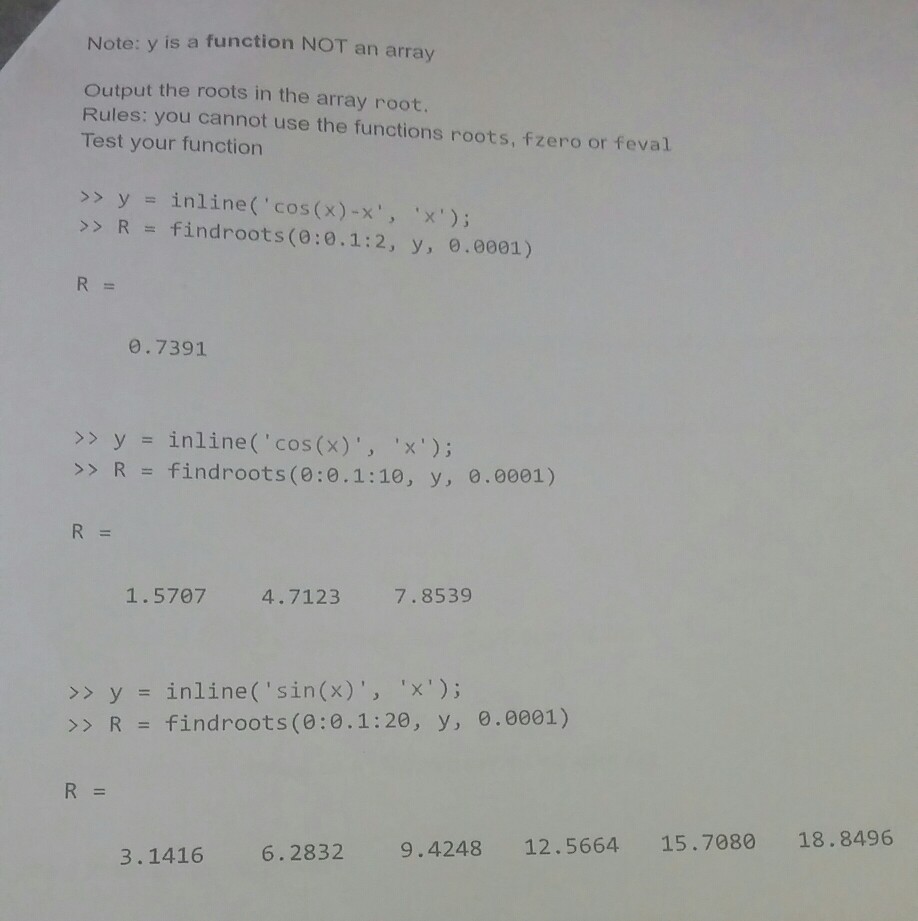
ENGIN 77 Lab #s Part 1: plotting As a class we will create a plot that shows sin(x) plotted for the following xvectors The X1, X2. x3, and X4 lines should be red dotted, red solid, black dotted, and black solid, respectively. Use a linewidth of 2 Use the following plotting functions to add a title, legend, x-axis label, and a y-axis label title( type the title of your plot here) legend("X1X2 x3,x4) x1abel('type the x-label here') ylabel('type the y-label here') Change the font size in your plot using the following line set(gca, font size", 14) Turn in the plot we made as a class saved as sinplot.fig Part 2: bisection method create a function with the headerline root find roots(x, y, tol) that will output all of the roots of a function (along the interval of x) using the bisection method. This function uses the inputs x which is a vector that has the starting and ending point over which you are lo roots (x = starting:interval:ending) y which is an inline function (see examples below) tol which is the tolerance used to find the roots (see examples below) oking for
Step by Step Solution
There are 3 Steps involved in it

Get step-by-step solutions from verified subject matter experts