

Question: This is my 3 rd posting this question, Can someone post the actual cpu and io gantt charts like a table CORRECTLY and fill in
This is my rd posting this question, Can someone post the actual cpu and io gantt charts like a table CORRECTLY and fill in the blanks with actual explanations for the whole question thank you!
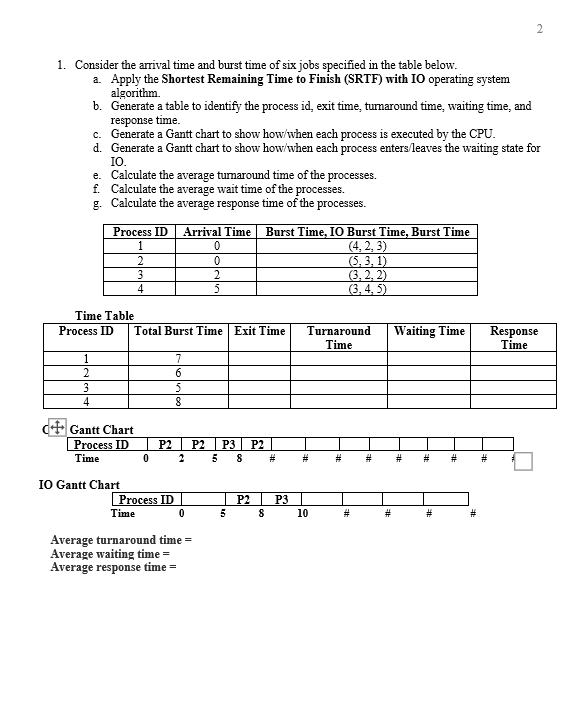
Consider the arrival time and burst time of six jobs specified in the table below.
a Apply the Shortest Remaining Time to Finish SRTF with IO operating system
algorithm
b Generate a table to identify the process id exit time, turnaround time, waiting time, and
response time.
c Generate a Gantt chart to show howwhen each process is executed by the CPU.
d Generate a Gantt chart to show howwhen each process entersleaves the waiting state for
IO
e Calculate the average tumaround time of the processes.
f Calculate the average wait time of the processes.
g Calculate the average response time of the processes.
Time Table
Gantt Chart
IO Gantt Chart
Average turnaround time
Average waiting time
Average response time
xxz
Step by Step Solution
There are 3 Steps involved in it
1 Expert Approved Answer
Step: 1 Unlock

Question Has Been Solved by an Expert!
Get step-by-step solutions from verified subject matter experts
Step: 2 Unlock
Step: 3 Unlock