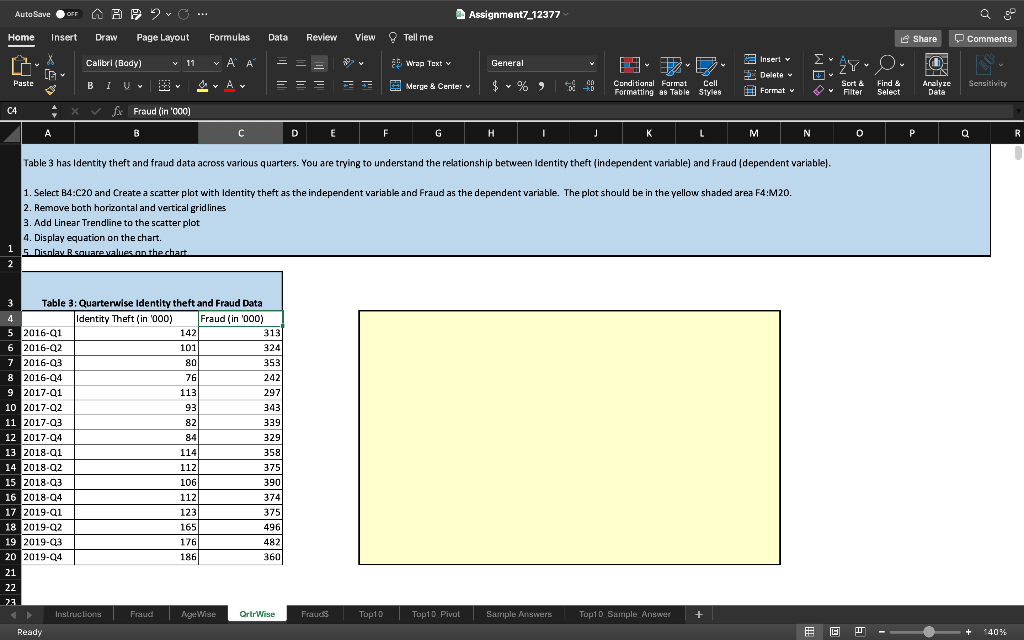
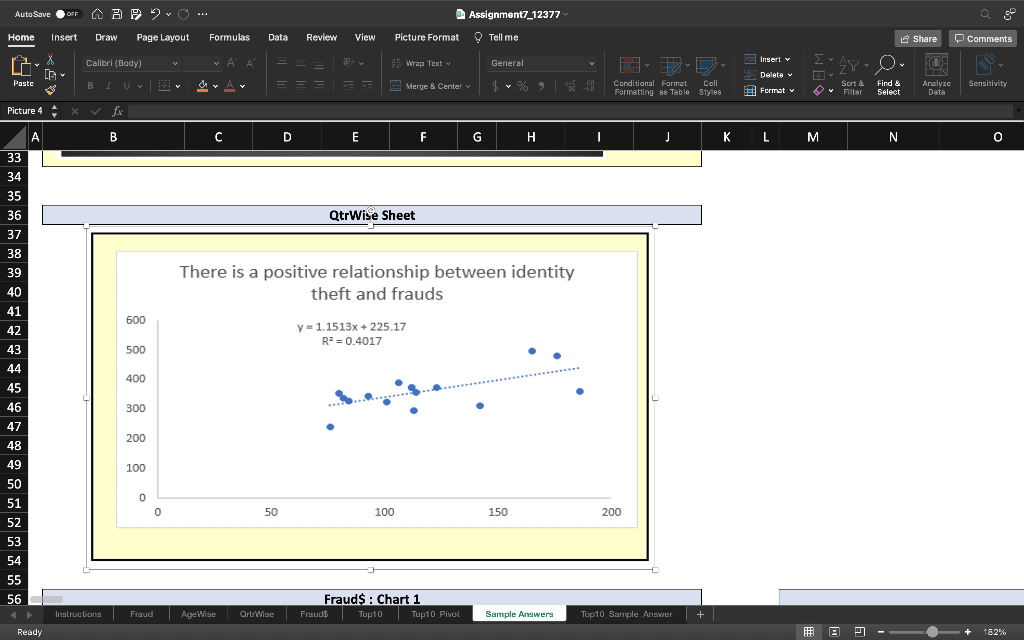
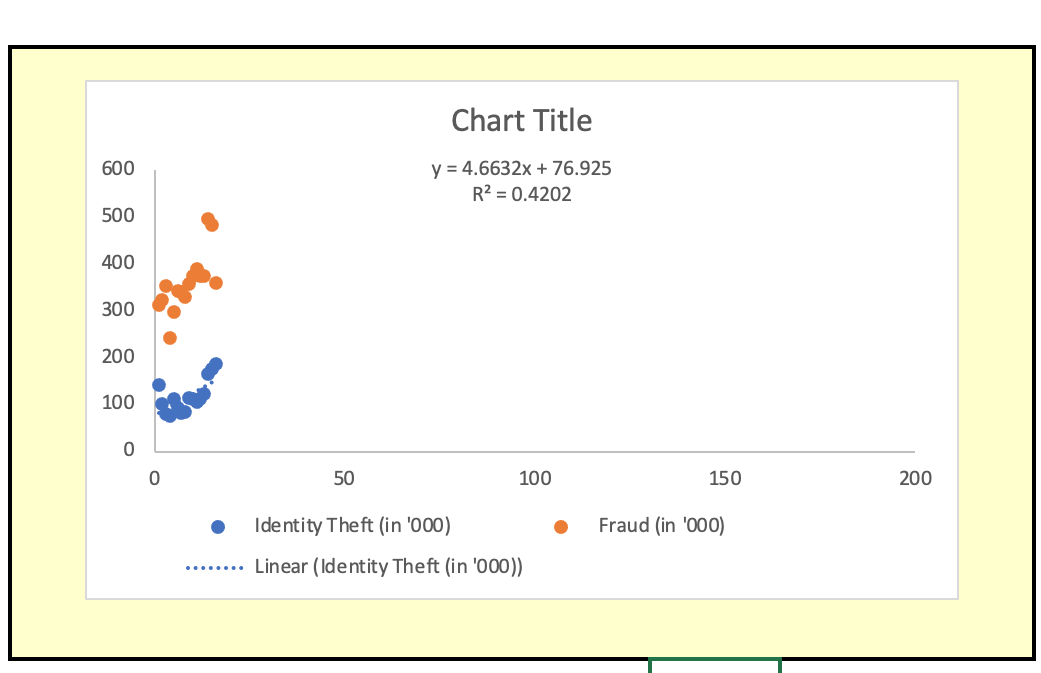
Question: This is my assignment question: This is the CORRECT chart to aim for: WHAT AM I DOING WRONG? (there is a tiny trend line in

This is my assignment question:

This is my assignment question: This is the

This is the CORRECT chart to aim for:

This is my assignment question: This is the

WHAT AM I DOING WRONG? (there is a tiny trend line in the cluster of blue dots)

This is my assignment question: This is the

Auto Save OFF APvc ... Assignment7_12377 Home Insert Draw Page Layout Formulas Data Review View Tell me Share Comments Calibri (Bady) V 11 ~ APA ab Wrap Text General Insert v X [ G AY : v Parte BI U 7 = = = Merge & Center Y Delete w Format Conditional Format Cell Formatting as Table Styles Y Sort & Filter Find & Select Sensitivity Analyze Data C4 fx Fraud (in '000) B A C D E F G H J L M N 0 Q R Table 3 has identity theft and fraud data across various quarters. You are trying to understand the relationship between Identity theft (independent variable) and Fraud (dependent variable). 1. Select B4:C20 and Create a scatter plot with Identity theft as the independent variable and Fraud as the dependent variable. The plot should be in the yellow shaded area F4:M20. 2. Remove both horizontal and vertical gridlines 3. Add Linear Trendline to the scatter plot 4. Display equation on the chart. 5. Disola Risauare values on thechart. 1 2 3 Table 3: Quarterwise Identity theft and Fraud Data 4 Identity Theft (in '000) Fraud (in 1000) 5 2016-01 142 313 6 2016-02 101 324 7 2016-03 80 353 8 2016-04 76 242 9 2017-01 1131 297 10 2017-02 93 343 11 2017-03 82 339 12 2017-04 84 329 13 2018-01 114 358 14 2018-a2 112 375 15 2018.93 106 390 16 2018-04 112 374 17 2019-01 123 375 18 2019-02 165 496 19 2019-03 176 482 20 2019-04 186 360 21 22 23 Instructions Fraud AgeWise Qrir Wise Ready Frauds Top10 Top10 Pivol Sample Answers Top10 Sample Answer + a 140% % Auto Save OFF APvc ... Assignment7_12377 Home Insert Draw Page Layout Formulas Data Review View Picture Format Tell me Share Comments Calibrl(Body) . A Insert v Wrap Textv General X C. G 9 TD Y Delete Paste B 1 I U = = = Merge & Center Y $ ~ % Sensitivity Conditional Format Cell Formatting as Table Styles Format Ou Sort & Filter Find & Select Analyze Data Picture 4 X A B D D E F G I J K L M N N 0 33 Qtr Wise Sheet 34 35 36 37 38 39 40 There is a positive relationship between identity theft and frauds 41 600 42 43 y = 1.1513x + 225.17 y = R2 = 0.4017 500 400 44 45 46 300 200 100 47 48 49 50 51 52 53 54 55 56 0 0 50 100 150 200 Fraud$ : Chart 1 Fraud$ Toplo Top10 Pivol $ Instructions Fraud Age Wise QrLrWise Sample Answers Top10 Sample Answer + Ready 182% Chart Title 600 y = 4.6632x + 76.925 R2 = 0.4202 500 400 300 200 100 0 0 50 100 150 200 Identity Theft (in '000) Fraud (in '000) .... Linear (Identity Theft (in '000))

Step by Step Solution

There are 3 Steps involved in it

1 Expert Approved Answer
Step: 1 Unlock blur-text-image
Question Has Been Solved by an Expert!

Get step-by-step solutions from verified subject matter experts

Step: 2 Unlock
Step: 3 Unlock

Students Have Also Explored These Related General Management Questions!