

Question: this is my question PRICE QUANTITY DEMANDED QUANTITY SUPPLIED 100 30.000 70,000 90 40,000 60,000 80 50,000 50,000 70 60,000 40,000 60 70,000 30,000 50
this is my question
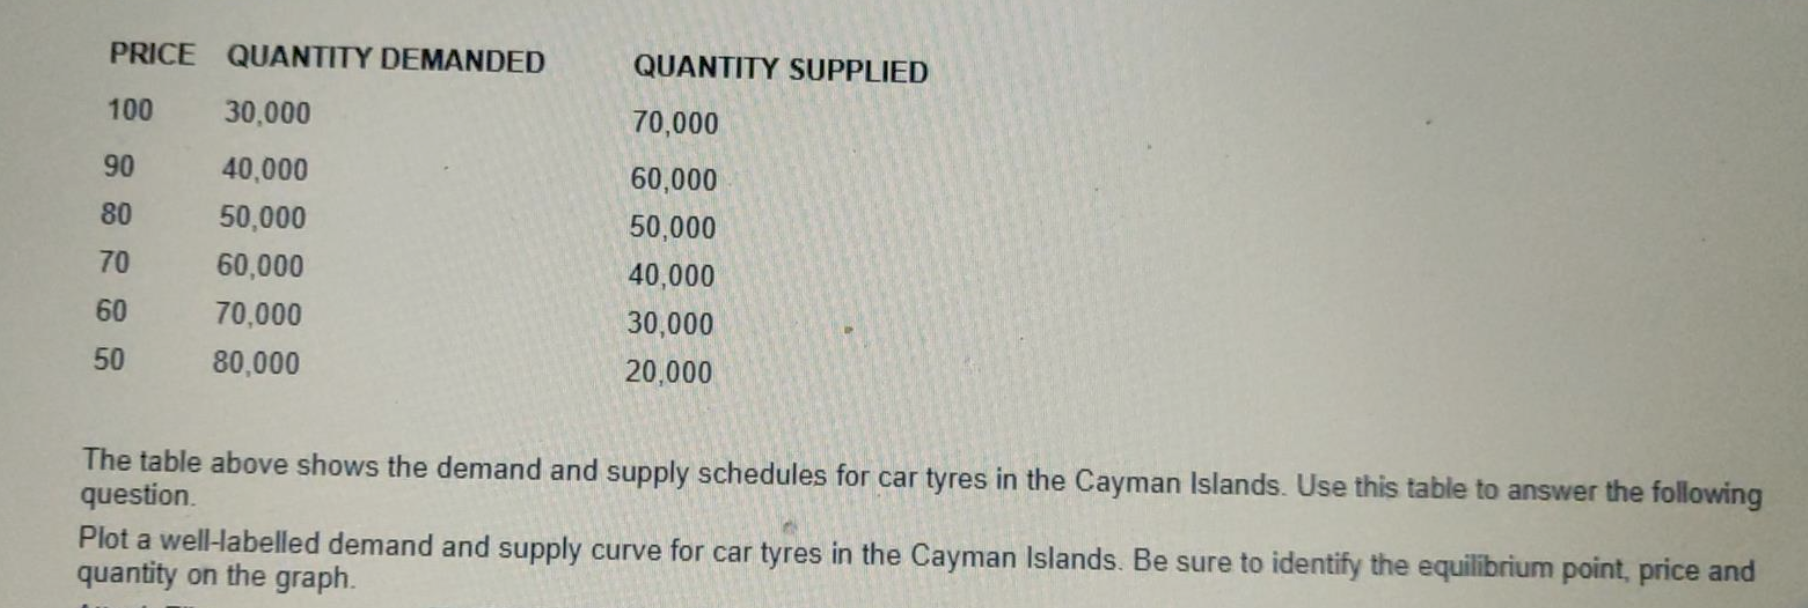
PRICE QUANTITY DEMANDED QUANTITY SUPPLIED 100 30.000 70,000 90 40,000 60,000 80 50,000 50,000 70 60,000 40,000 60 70,000 30,000 50 80,000 20,000 The table above shows the demand and supply schedules for car tyres in the Cayman Islands. Use this table to answer the following question. Plot a well-labelled demand and supply curve for car tyres in the Cayman Islands. Be sure to identify the equilibrium point, price and quantity on the graph
Step by Step Solution
There are 3 Steps involved in it
1 Expert Approved Answer
Step: 1 Unlock

Question Has Been Solved by an Expert!
Get step-by-step solutions from verified subject matter experts
Step: 2 Unlock
Step: 3 Unlock