

Question: this is no 3 QUESTION 2 (CLO2) You have been presented with the following data and asked to fit statistical demand functions QUANTITY 120 165
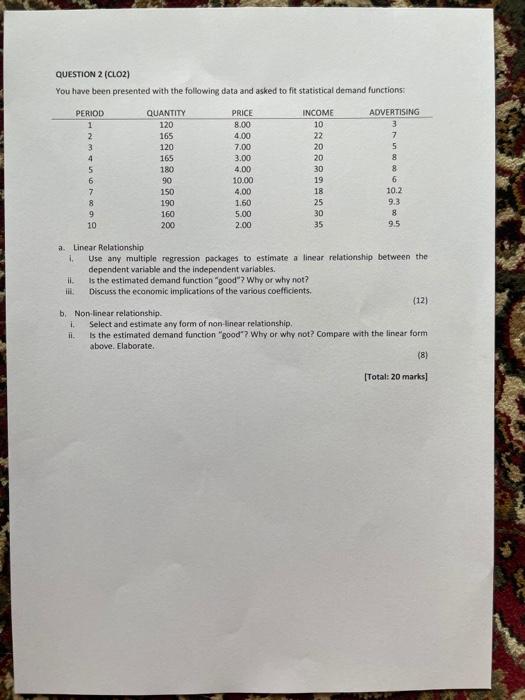
QUESTION 2 (CLO2) You have been presented with the following data and asked to fit statistical demand functions QUANTITY 120 165 PERIOD 1 2 3 4 5 6 7 8 9 10 120 165 180 90 150 190 160 200 PRICE 8.00 4.00 7.00 3.00 4.00 10.00 4.00 1.60 5.00 2.00 INCOME 10 22 20 20 30 19 18 25 30 35 wwBE ADVERTISING 3 7 5 8 8 6 10.2 9.3 8 9.5 a Linear Relationship 1 Use any multiple regression packages to estimate a linear relationship between the dependent variable and the independent variables. il is the estimated demand function "good"? Why or why not? II Discuss the economic implications of the various coefficients. (12) b. Non-linear relationship i Select and estimate any form of non-linear relationship II. Is the estimated demand function "good"? Why or why not? Compare with the linear form above. Elaborate (8) [Total: 20 marks]
Step by Step Solution
There are 3 Steps involved in it

Get step-by-step solutions from verified subject matter experts