

Question: This is one problem, can you help me with the WHOLE problem? Thank you in advance. A grocery store manager did a study to look
This is one problem, can you help me with the WHOLE problem? Thank you in advance.
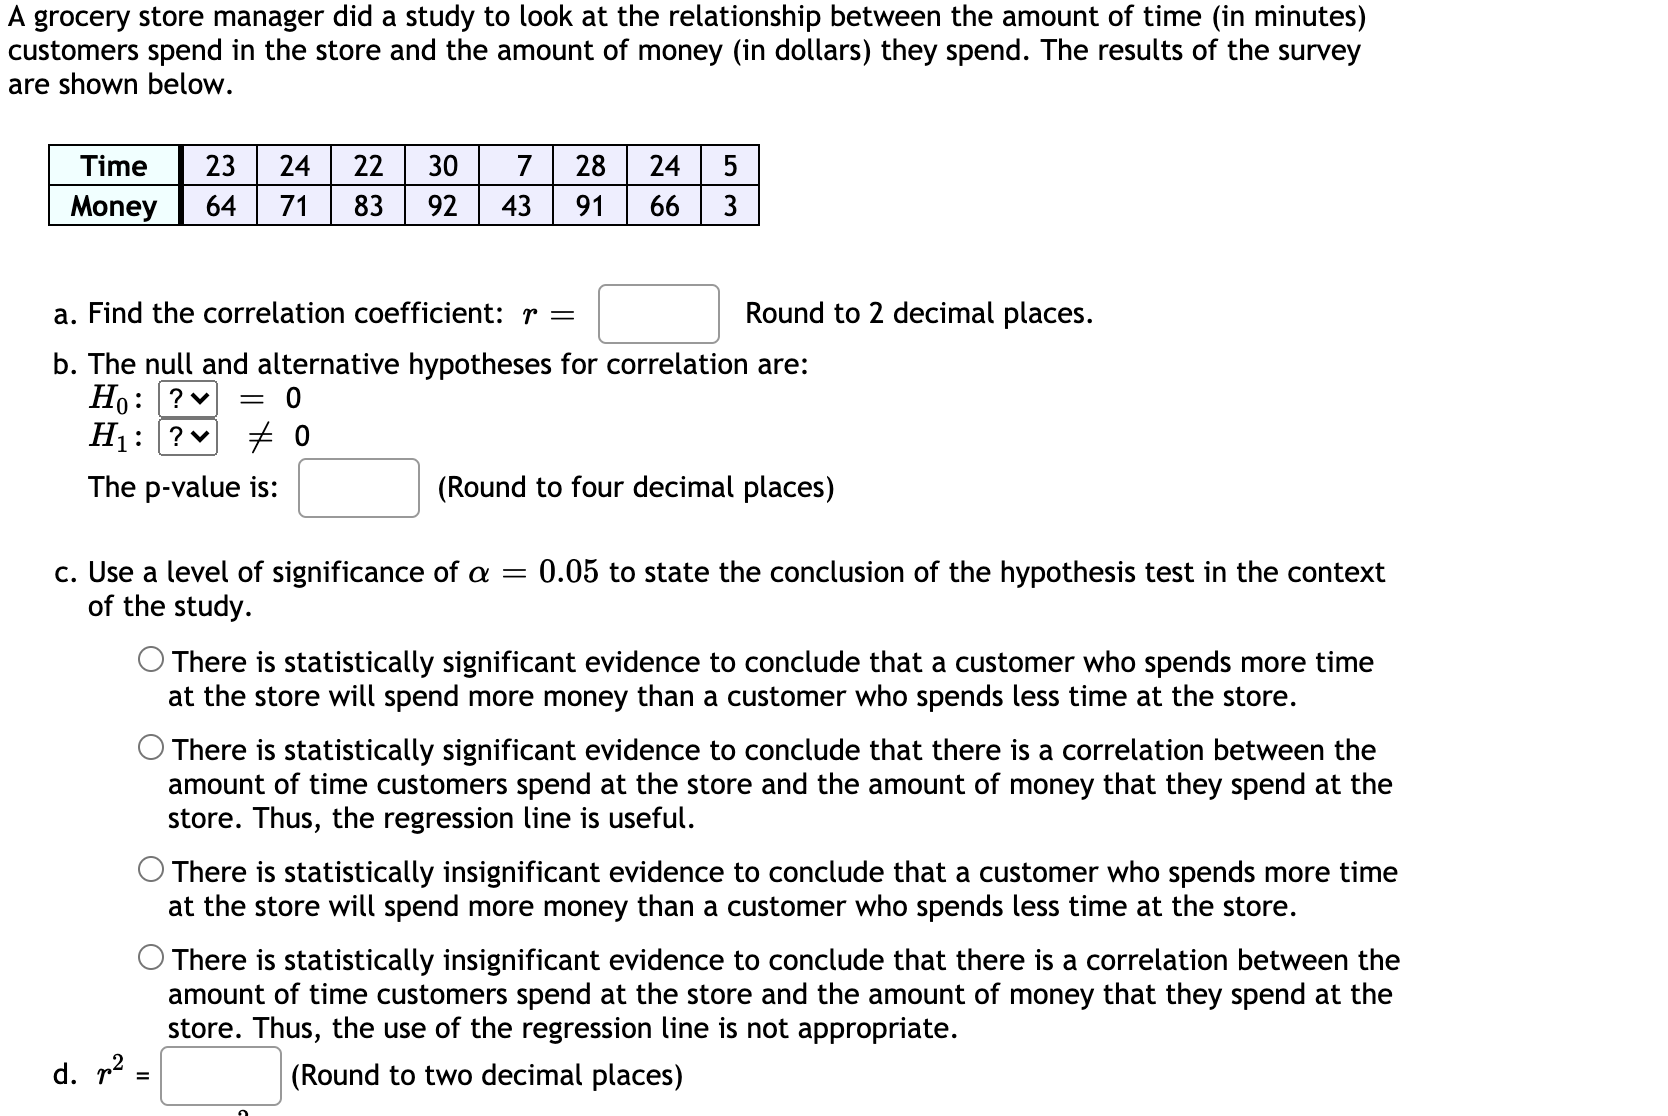
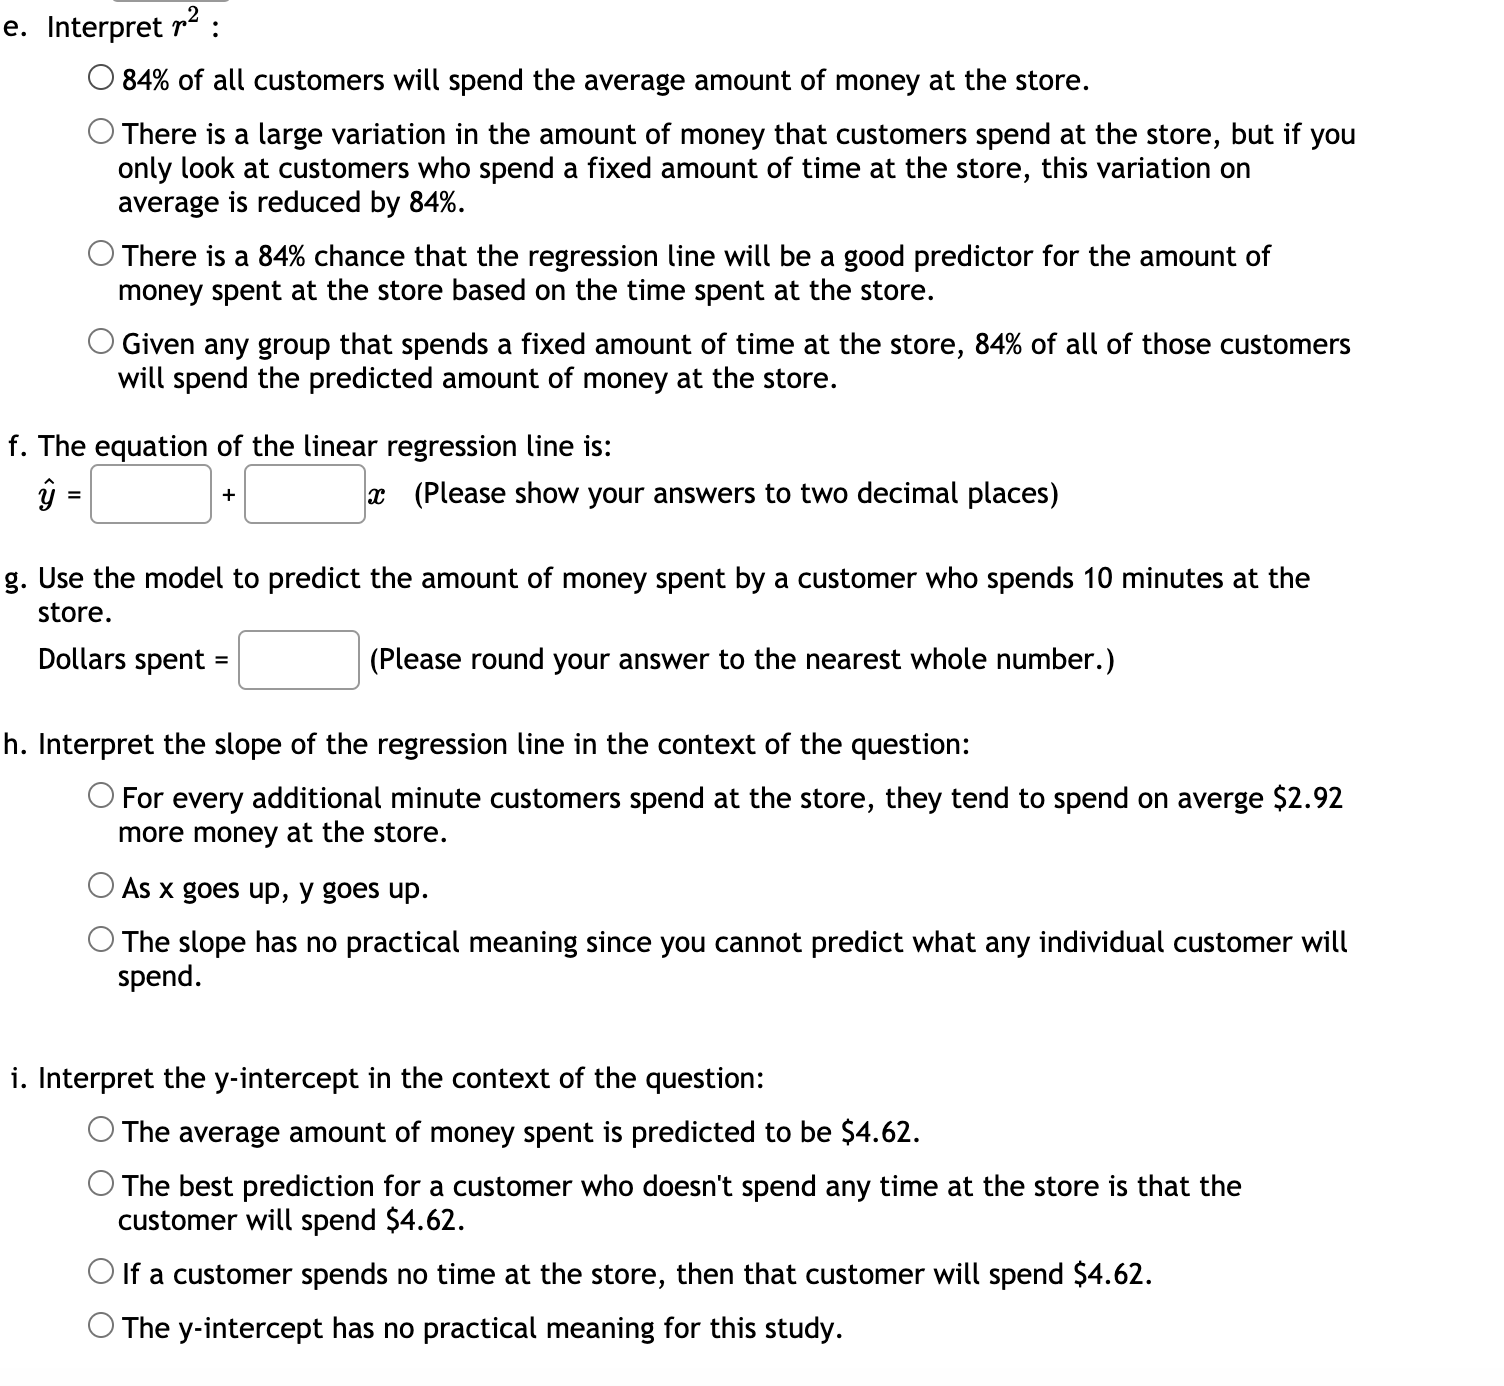
A grocery store manager did a study to look at the relationship between the amount of time (in minutes) customers spend in the store and the amount of money (in dollars) they spend. The results of the survey are shown below. Time 23 24 22 30 7 28 24 5 Money 64 71 83 92 43 91 66 3 a. Find the correlation coefficient: r = [3 Round to 2 decimal places. b. The null and alternative hypotheses for correlation are: HUI-=0 H11- 750 The p-value is: [:I (Round to four decimal places) c. Use a level of significance of a = 0.05 to state the conclusion of the hypothesis test in the context of the study. 0 There is statistically significant evidence to conclude that a customer who spends more time at the store will spend more money than a customer who spends less time at the store. 0 There is statistically significant evidence to conclude that there is a correlation between the amount of time customers spend at the store and the amount of money that they spend at the store. Thus, the regression line is useful. 0 There is statistically insignificant evidence to conclude that a customer who spends more time at the store will spend more money than a customer who spends less time at the store. 0 There is statistically insignificant evidence to conclude that there is a correlation between the amount of time customers spend at the store and the amount of money that they spend at the store. Thus, the use of the regression line is not appropriate. d. r2 = C] (Round to two decimal places) e. Interpret r2 O 84% of all customers will spend the average amount of money at the store. 0 There is a large variation in the amount of money that customers spend at the store, but if you only look at customers who spend a fixed amount of time at the store, this variation on average is reduced by 84%. Q There is a 84% chance that the regression line will be a good predictor for the amount of money spent at the store based on the time spent at the store. 0 Given any group that spends a fixed amount of time at the store, 84% of all of those customers will spend the predicted amount of money at the store. heequation of the linear regression line is. ;=:] S3: (Please show your answers to two decimal places) g. Use the model to predict the amount of money spent by a customer who spends 10 minutes at the store. Dollars spent = C] (Please round your answer to the nearest whole number.) h. Interpret the slope of the regression line in the context of the question: 0 For every additional minute customers spend at the store, they tend to spend on averge $2.92 more money at the store. 0 As x goes up, y goes up. 0 The slope has no practical meaning since you cannot predict what any individual customer will spend. i. Interpret the y-intercept in the context of the question: 0 The average amount of money spent is predicted to be $4.62. 0 The best prediction for a customer who doesn't spend any time at the store is that the customer will spend $4.62. 0 If a customer spends no time at the store, then that customer will spend $4.62. 0 The y-intercept has no practical meaning for this study
Step by Step Solution
There are 3 Steps involved in it

Get step-by-step solutions from verified subject matter experts