

Question: This is part of a statistical analysis report for a psy class For the Scenario I need to figure out the following, if you can
This is part of a statistical analysis report for a psy class
For the Scenario I need to figure out the following, if you can by typing NOT handwritten please because I have a hard time reading most handwriting on here. It will not help if I cannot read it or have a hard time making out what it says.
I had to appropriately labeled histogram for each set of data. I want to know if it is labeled correctly. I need to Evaluate the shape of each distribution using the created histograms. In other words, what does the shape of each distribution tell us about the data?
Data Analysis: of Histograms
Data Analysis: Shape
Results: Valid?
Results: Statistically Significant?
Scenario 2 (Forensic Psychology) Levels of groups' certainties about their eyewitness testimony to a simulated crime were compared. The first group was set up to be "right" in its eyewitness accounts and the second group was set up to be "wrong"; the desire was to see if confidence differed across groups. Thirty-four participants were recruited from a college campus and randomly divided into two groups, both of which were shown a video of a crime scenario (length: 58 seconds) in which the perpetrator's facial characteristics (with respect to the camera) were clearly visible at two separate points and sporadically visible at others. Half the participants then were shown a five-individual lineup that contained the perpetrator in the video ("Group A"), and half the participants were shown a five-individual lineup that did not contain the perpetrator ("Group B"). Participants were asked to (a) identify if and where the perpetrator was in the lineup and (b) provide a rating of confidence on a scale from 1 to 10 (10 being highly confident) that the selection was the same as the person seen in the video committing the crime. All participants signed consent forms; were told they could leave the study at any time and were told they would be debriefed. Data on the confidence ratings are shown below (also found in the Data Set Scenario 2 Excel file).
Group A Confidence Group B Confidence
07 10
10 05
09 05
10 10
08 07
05 06
10 10
10 09
01 03
10 06
05 04
06 10
07 10
06 10
04 03
05 07
10 08
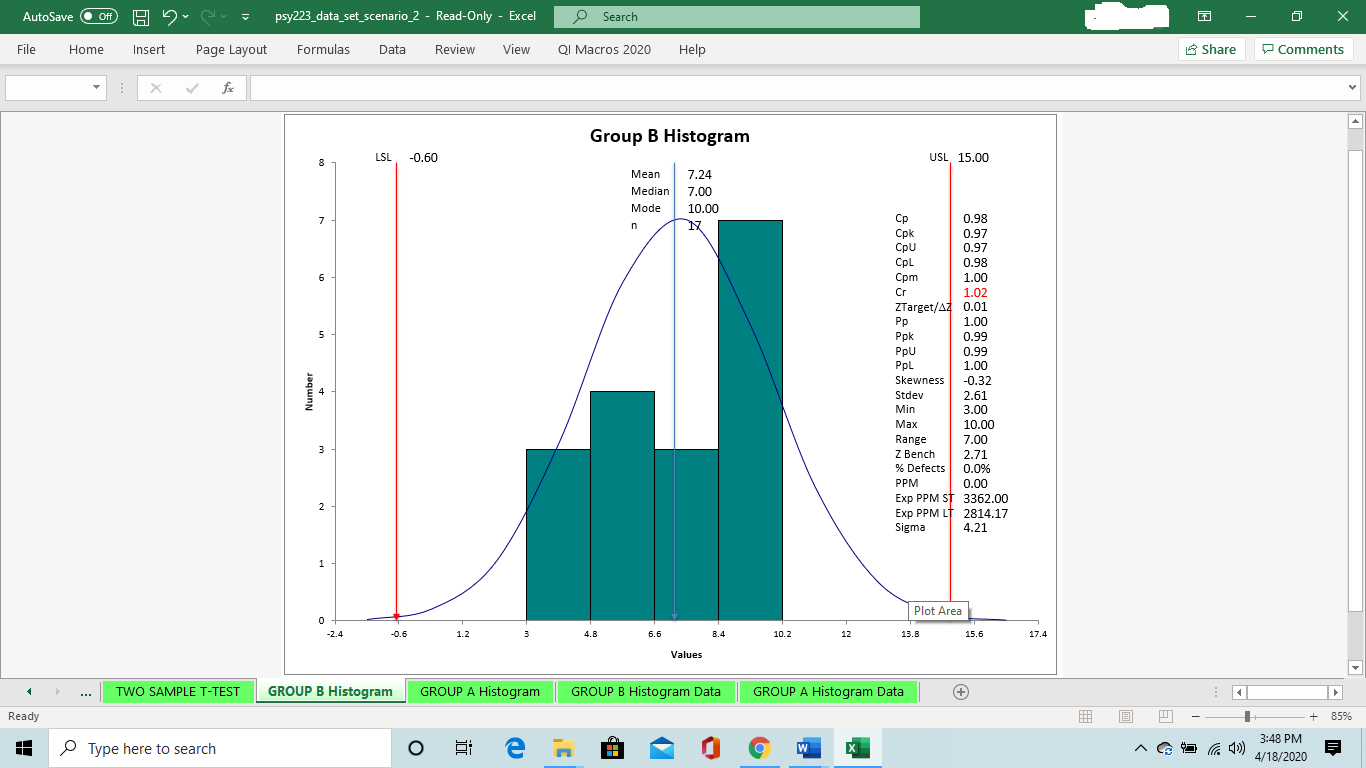
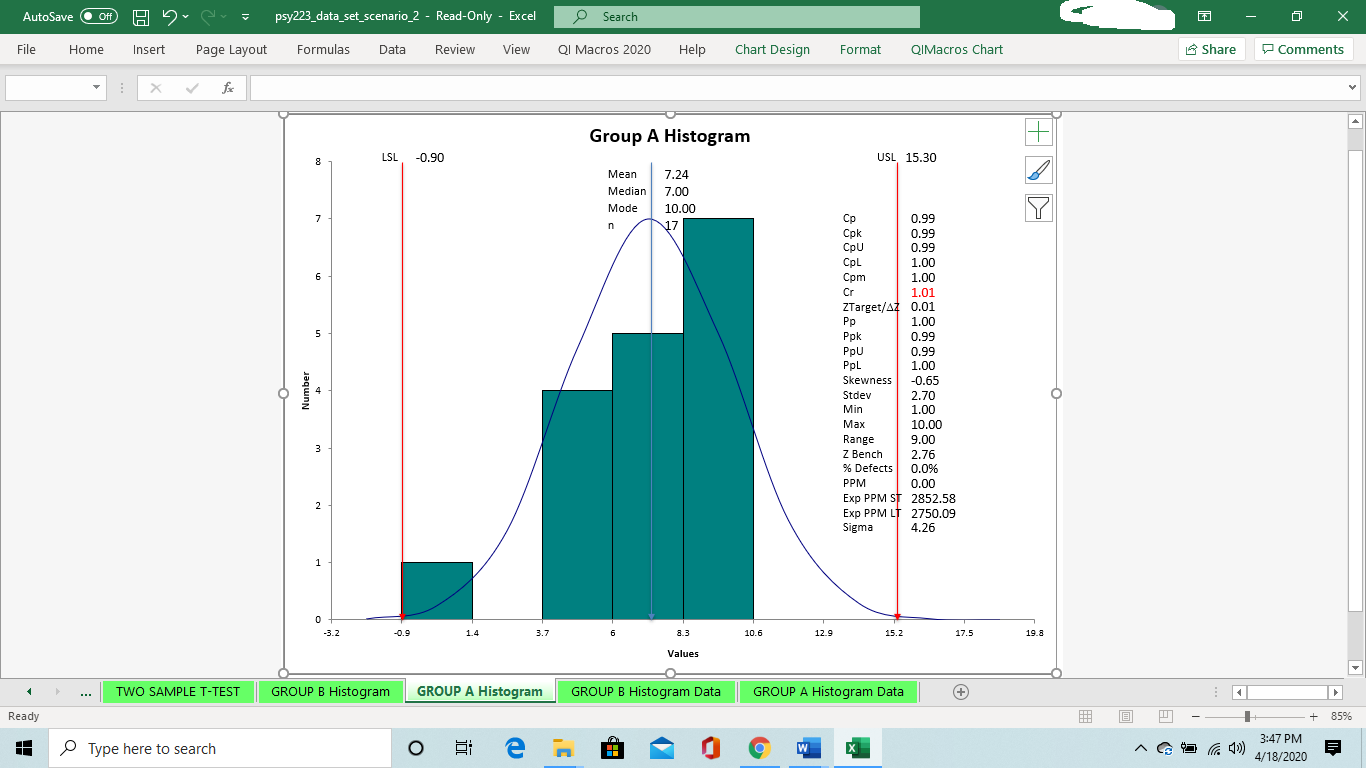
AutoSave O Off) H v v v psy223_data_set_scenario_2 - Read-Only - Excel Search X File Home Insert Page Layout Formulas Data Review View QI Macros 2020 Help Share Comments X V Group B Histogram USL 15.00 8 LSL -0.60 Mean 7.24 Median 7.00 Mode 10.00 7 n 17 Cp 0.98 Cpk 0.97 CPU 0.97 CPL 0.98 Cpm 1.0 Cr 1.02 ZTarget/47 0.01 1.00 Ppk 0.99 PPU 0.9 PPL 1.00 Number Skewness -0.32 + Stde 2.61 Min 3.0 Max 10.00 Range 7.00 w Z Bench 2.71 % Defects 0.0% PPM 0.00 Exp PPM ST 3362.00 N Exp PPM LT 2814.17 Sigma 4.21 Plot Area -24 -0.6 1.2 3 4.8 6. B.4 10. 12 13.8 15.6 17.4 Values TWO SAMPLE T-TEST GROUP B Histogram GROUP A Histogram GROUP B Histogram Data GROUP A Histogram Data + . .. + 85% Ready 3:48 PM Type here to search O em W 4/18/2020AutoSave O Off) H v v v psy223_data_set_scenario_2 - Read-Only - Excel Search X Comments File Home Insert Page Layout Formulas Data Review View QI Macros 2020 Help Chart Design Format QIMacros Chart Share X V Group A Histogram + 8 LSL -0.90 USL 15.30 Mean 7.24 Median 7.00 Mode 10.00 7 n 17 Cp 0.99 Cpk 0.99 CPU 0.95 CPL 1.00 Cpm 1.00 Cr 1.01 ZTarget/47 0.01 Pp 1.00 un Ppk 0.9 PPU 0.9 PPL 1.00 Number Skewness -0.65 Stdev 2.70 Min 1.00 Max 10.00 Range 9.00 W Z Bench 2.76 % Defec 0.0% PPM 0.00 Exp PPM ST 2852.58 Exp PPM LT 2750.09 Sigma 4.26 1 0 -3.7 -0.9 14 3. 6 10.6 12.9 15.2 17. 19.8 Values . .. TWO SAMPLE T-TEST GROUP B Histogram GROUP A Histogram GROUP B Histogram Data GROUP A Histogram Data + + 85% Ready 3:47 PM Type here to search O em W 4/18/2020
Step by Step Solution
There are 3 Steps involved in it

Get step-by-step solutions from verified subject matter experts