

Question: this is Quantitative Methods for Business, please show the furmula Mobile-phone manufacturers would like us to believe that phone quality is closely reflected by its
this is Quantitative Methods for Business, please show the furmula
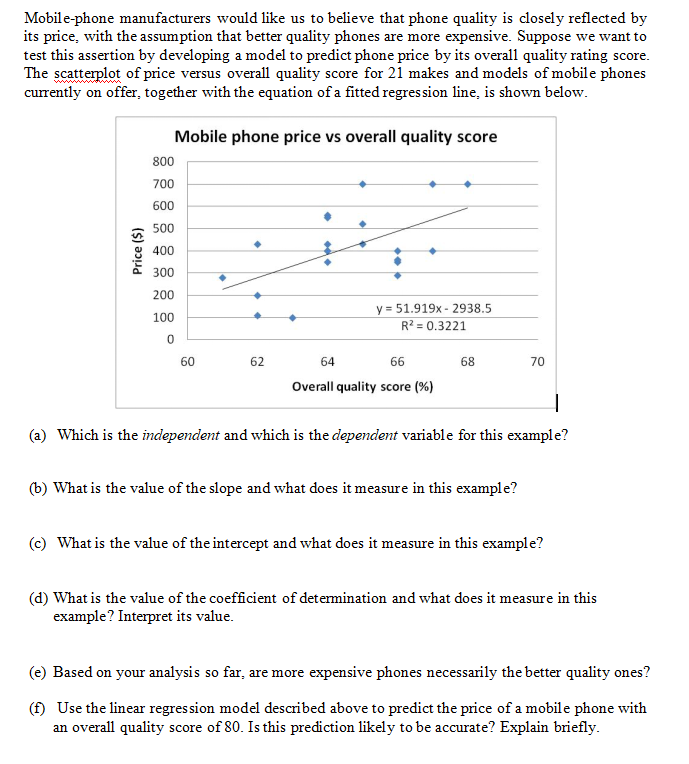
Mobile-phone manufacturers would like us to believe that phone quality is closely reflected by its price, with the assumption that better quality phones are more expensive. Suppose we want to test this assertion by developing a model to predict phone price by its overall quality rating score. The scatterplot of price versus overall quality score for 21 makes and models of mobile phones currently on offer, together with the equation of a fitted regression line, is shown below. Mobile phone price vs overall quality score 800 700 600 Price ($) 500 400 300 200 100 y = 51.919x - 2938.5 R? = 0.3221 0 60 62 64 66 68 70 Overall quality score (%) (a) Which is the independent and which is the dependent variable for this example? (b) What is the value of the slope and what does it measure in this example? (c) What is the value of the intercept and what does it measure in this example? (d) What is the value of the coefficient of determination and what does it measure in this example? Interpret its value. (e) Based on your analysis so far, are more expensive phones necessarily the better quality ones? (f) Use the linear regression model described above to predict the price of a mobile phone with an overall quality score of 80. Is this prediction likely to be accurate? Explain briefly
Step by Step Solution
There are 3 Steps involved in it

Get step-by-step solutions from verified subject matter experts