

Question: This is similar to a problem in the textbook. table [ [ Time ( months ) , 0 1 , 2 , 3 ,
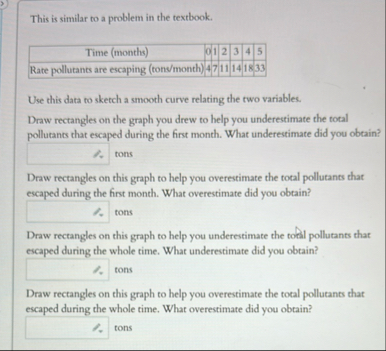
This is similar to a problem in the textbook.
tableTime monthsRate pollutants are escaping tonsmonth
Use this data to sketch a smooth curve relating the two variables.
Draw rectangles on the graph you drew to help you underestimate the total pollutants that escaped during the first month. What underestimate did you obtain?
tons
Draw rectangles on this graph to help you overestimate the total pollutants that escaped during the first month. What overestimate did you obtain?
tons
Draw rectangles on this graph to help you underestimate the total pollutants that escaped during the whole time. What underestimate did you obtain?
tons
Draw rectangles on this graph to help you overestimate the total pollutants that escaped during the whole time. What overestimate did you obtain?
tons
Step by Step Solution
There are 3 Steps involved in it
1 Expert Approved Answer
Step: 1 Unlock

Question Has Been Solved by an Expert!
Get step-by-step solutions from verified subject matter experts
Step: 2 Unlock
Step: 3 Unlock