

Question: This is statistics course and I need help with this questions. This is Confidence Intervals for Differences of Means and Slopes unit. ANd this is
This is statistics course and I need help with this questions. This is Confidence Intervals for Differences of Means and Slopes unit. ANd this is the data for question 8.
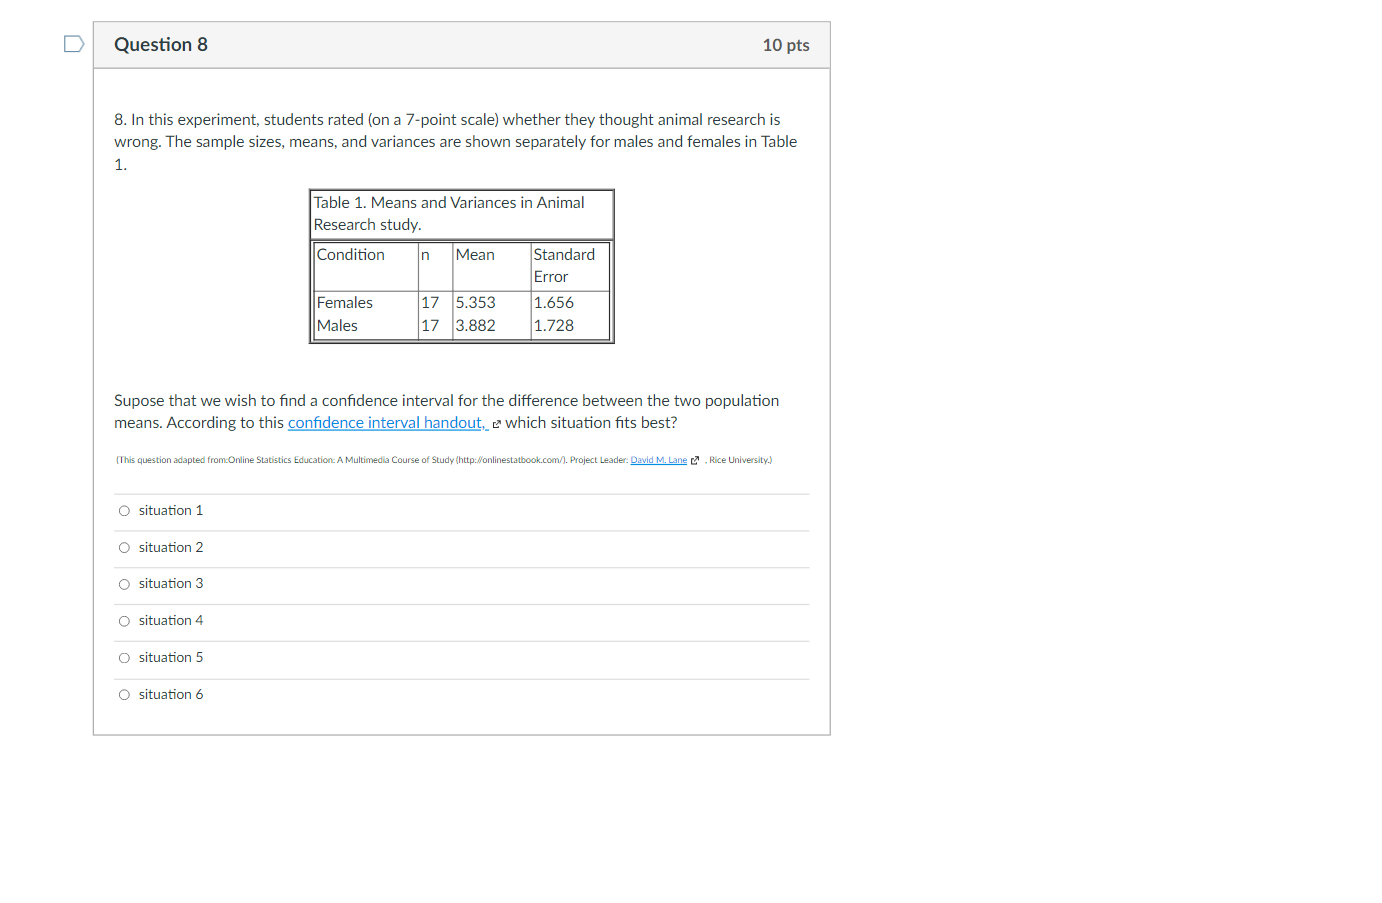
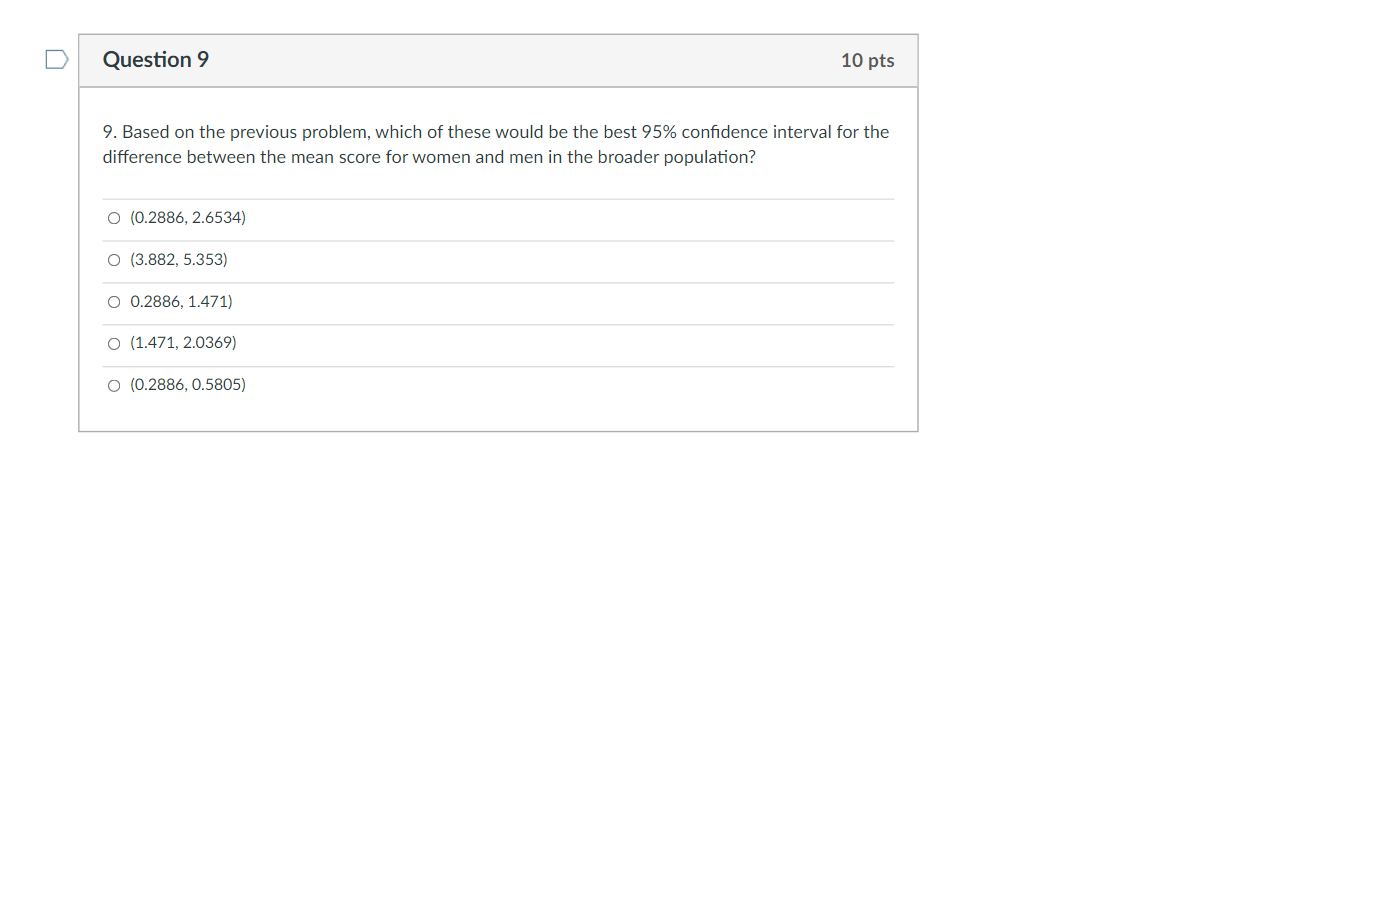
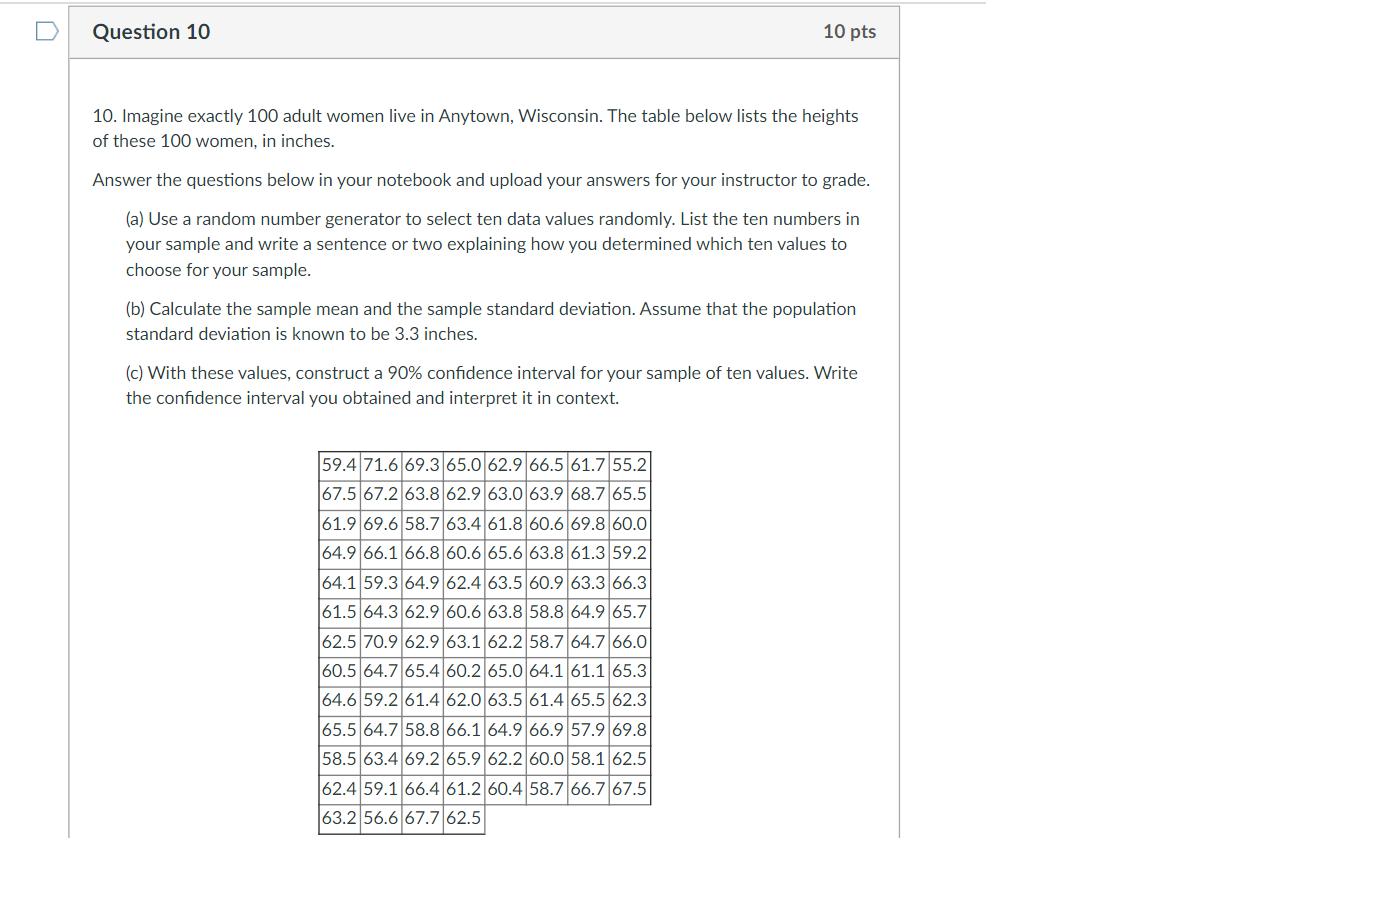
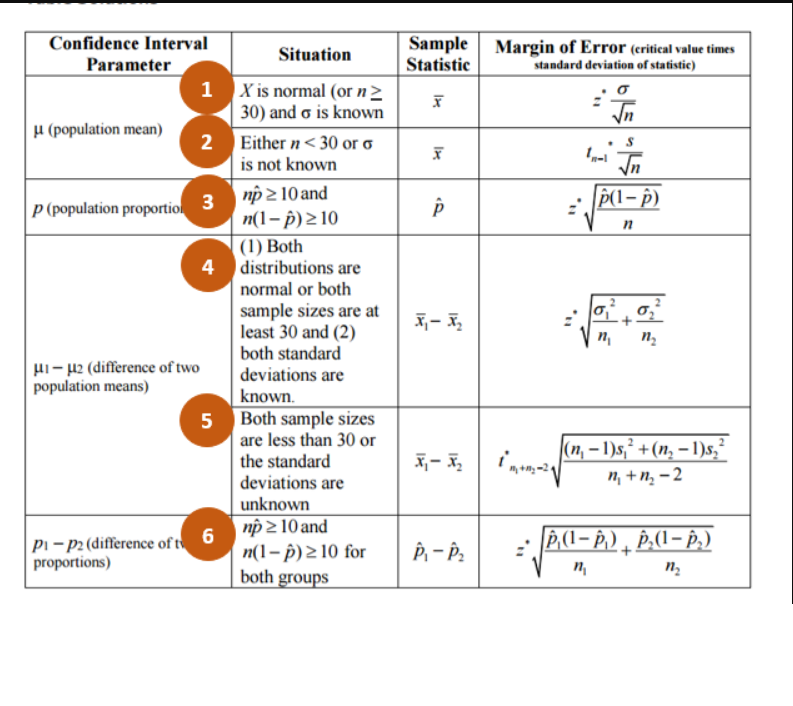
D Question 8 10 pts 8. In this experiment, students rated (on a 7-point scale) whether they thought animal research is wrong. The sample sizes, means, and variances are shown separately for males and females in Table 1. Table 1. Means and Variances in Animal Research study Condition n Mean Standard Error Females 17 15.353 1.656 Males 7 3.882 1.728 Supose that we wish to find a confidence interval for the difference between the two population means. According to this confidence interval handout,_ _ which situation fits best? This question adapted from Online Statistics Education: A Multimedia Course of Study (http:/onlinestatbook.com/]. Project Leader: David M. Lane [ . Rice University.) O situation 1 O situation 2 O situation 3 O situation 4 O situation 5 O situation 6D Question 9 10 pts 9. Based on the previous problem, which of these would be the best 95% confidence interval for the difference between the mean score for women and men in the broader population? O (0.2886, 2.6534) O (3.882, 5.353) O 0.2886, 1.471) O (1.471, 2.0369) O (0.2886, 0.5805)Question 10 10 pts 10. Imagine exactly 100 adult women live in Anytown, Wisconsin. The table below lists the heights of these 100 women, in inches. Answer the questions below in your notebook and upload your answers for your instructor to grade. (a) Use a random number generator to select ten data values randomly. List the ten numbers in your sample and write a sentence or two explaining how you determined which ten values to choose for your sample. (b) Calculate the sample mean and the sample standard deviation. Assume that the population standard deviation is known to be 3.3 inches. (c) With these values, construct a 90% condence interval for your sample often values. Write the condence interval you obtained and interpret it in context. 71.6 675 67.2 63.8 62.9 63.0 63.9 63.7 65.5 61 9 69.6 58.7 63.4 61.8 60.6 69.8 60.0 6 .1 3 64.9 6 66.3 60.6 65.6 63.3 61.3 59.2 61.5 64. 62.9 60.6 62.5 70.9 62.9 63.1 62.2 53.7 64.7 66.0 64.6 9.2 61.4 62.0 63.5 61.4 65.5 62.3 . 53.1 . 6.7 .6 Ul 5 58.5 634 69.2 65.9 62.2 60.0 62.4 59 1 66.4 61.2 60.4 58.7 6 Confidence Interval Situation Sample Margin of Error (critical value times Parameter Statistic standard deviation of statistic) X is normal (or n 2 30) and o is known H (population mean) 2 Either n
Step by Step Solution
There are 3 Steps involved in it

Get step-by-step solutions from verified subject matter experts