

Question: This is the 3rd post so please provide the correct & complete answers this time, thanks in advance. Springwater Brewery has two main products: premium
This is the 3rd post so please provide the correct & complete answers this time, thanks in advance.
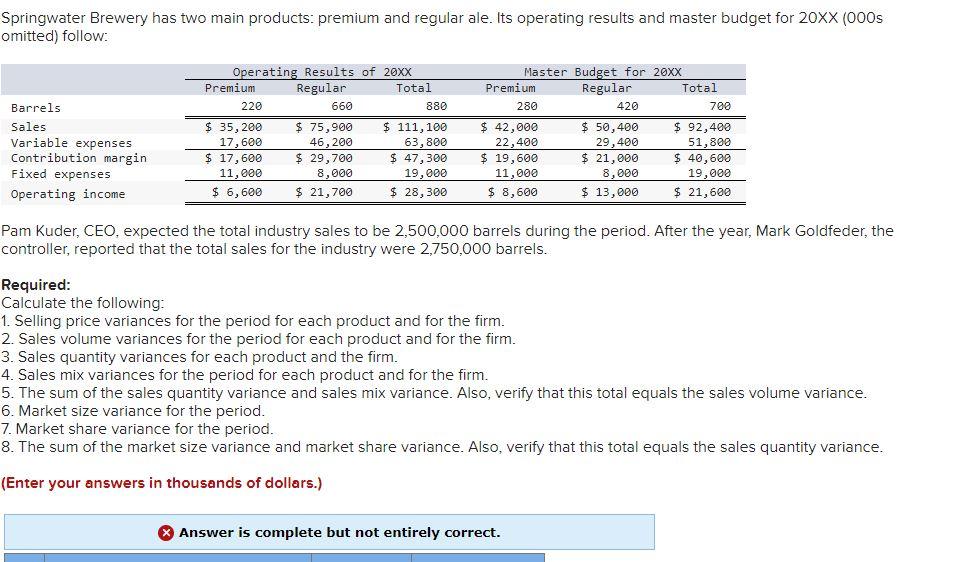
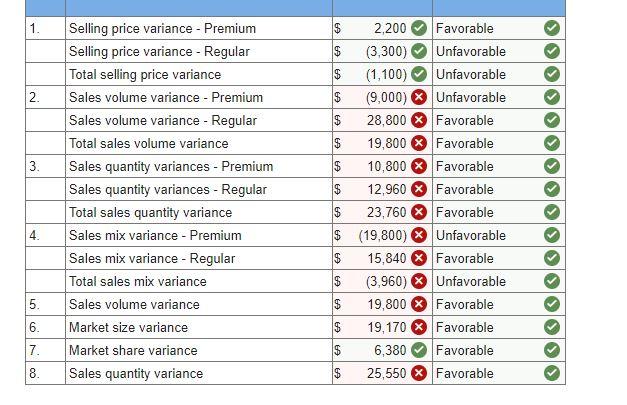
Springwater Brewery has two main products: premium and regular ale. Its operating results and master budget for 20XX (000s omitted) follow: Barrels Sales Variable expenses Contribution margin Fixed expenses Operating income Operating Results of 20XX Premium Regular Total 220 660 880 $ 35, 200 $ 75,900 $ 111,100 17,600 46,200 63,800 $ 17,600 $ 29,700 $ 47,300 11,000 8,000 19,000 $ 6,600 $ 21,700 $ 28,300 Master Budget for 20xx Premium Regular Total 280 420 700 $ 42,000 $ 50,400 $ 92,400 22,400 29,400 51,800 $ 19,600 $ 21,000 $ 40,600 11,000 8,000 19,000 $ 8,600 $ 13,000 $ 21,600 Pam Kuder, CEO, expected the total industry sales to be 2,500,000 barrels during the period. After the year, Mark Goldfeder, the controller, reported that the total sales for the industry were 2,750,000 barrels. Required: Calculate the following: 1. Selling price variances for the period for each product and for the firm. 2. Sales volume variances for the period for each product and for the firm. 3. Sales quantity variances for each product and the firm. 4. Sales mix variances for the period for each product and for the firm. 5. The sum of the sales quantity variance and sales mix variance. Also, verify that this total equals the sales volume variance. 6. Market size variance for the period. 7. Market share variance for the period. 8. The sum of the market size variance and market share variance. Also, verify that this total equals the sales quantity variance. (Enter your answers in thousands of dollars.) Answer is complete but not entirely correct. 1. 69 2. AGAGA 3. Selling price variance - Premium Selling price variance - Regular Total selling price variance Sales volume variance - Premium Sales volume variance - Regular Total sales volume variance Sales quantity variances - Premium Sales quantity variances - Regular Total sales quantity variance Sales mix variance - Premium Sales mix variance - Regular Total sales mix variance Sales volume variance Market size variance Market share variance Sales quantity variance 2,200 Favorable $ (3,300) Unfavorable $ (1,100) Unfavorable $ (9,000) Unfavorable $ 28,800 Favorable $ 19,800 Favorable 10,800 Favorable $ 12,960 Favorable 23,760 Favorable $ (19,800) Unfavorable 15,840 Favorable $ (3,960) Unfavorable $ 19,800 Favorable $ 19,170 Favorable $ 6,380 Favorable $ 25,550 X Favorable 4. 6999 5. 001 6. 7. | | 8
Step by Step Solution
There are 3 Steps involved in it

Get step-by-step solutions from verified subject matter experts