

Question: This is the answer but I need to know how to do the working. Show all steps and explanation. TQ 1. You are given the
 This is the answer but I need to know how to do the working. Show all steps and explanation. TQ
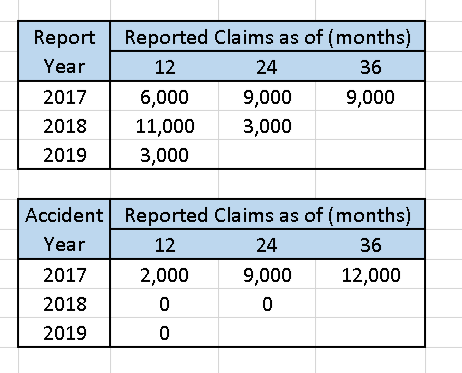
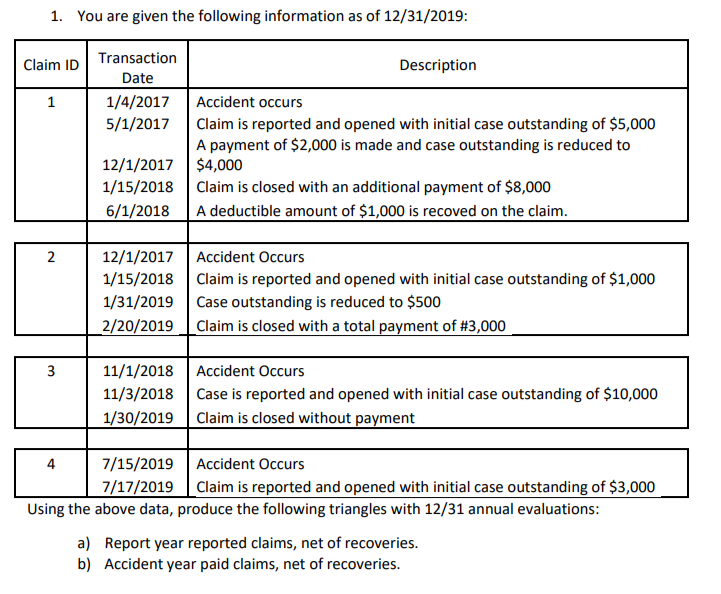
1. You are given the following information as of 12/31/2019: Using the above data, produce the following triangles with 12/31 annual evaluations: a) Report year reported claims, net of recoveries. b) Accident year paid claims, net of recoveries. \begin{tabular}{|c|ccc|} \hline \multirow{2}{*}{ReportYear} & \multicolumn{3}{|c|}{ Reported Claims as of (months) } \\ \cline { 2 - 4 } & 12 & 24 & 36 \\ \hline 2017 & 6,000 & 9,000 & 9,000 \\ \hline 2018 & 11,000 & 3,000 & \\ 2019 & 3,000 & & \\ \hline \end{tabular} \begin{tabular}{|c|ccc|} \hline \multirow{2}{*}{AccidentYear} & \multicolumn{3}{|c|}{ Reported Claims as of (months) } \\ \cline { 2 - 4 } & 12 & 24 & 36 \\ \hline 2017 & 2,000 & 9,000 & 12,000 \\ 2018 & 0 & 0 & \\ 2019 & 0 & & \\ \hline \end{tabular}
Step by Step Solution
There are 3 Steps involved in it

Get step-by-step solutions from verified subject matter experts