

Question: This is the answer, I am having trouble understanding why and how to do it Eight samples of ten parts each were taken from an
This is the answer, I am having trouble understanding why and how to do it
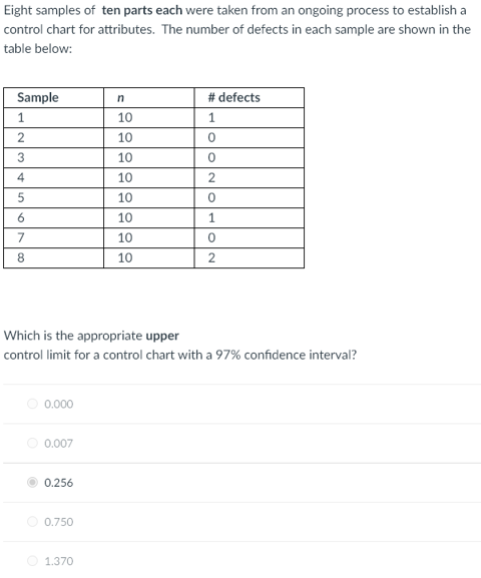
Eight samples of ten parts each were taken from an ongoing process to establish a control chart for attributes. The number of defects in each sample are shown in the table below: Which is the appropriate upper control limit for a control chart with a 97% confidence interval? 0.000 0.007 0.256 0.750 1.370
Step by Step Solution
There are 3 Steps involved in it
1 Expert Approved Answer
Step: 1 Unlock

Question Has Been Solved by an Expert!
Get step-by-step solutions from verified subject matter experts
Step: 2 Unlock
Step: 3 Unlock