

Question: This is the complete question b. Suppose you are considering two possible investment opportunities: a 12-year Treasury bond and a 7-year, A-rated corporate bond. The
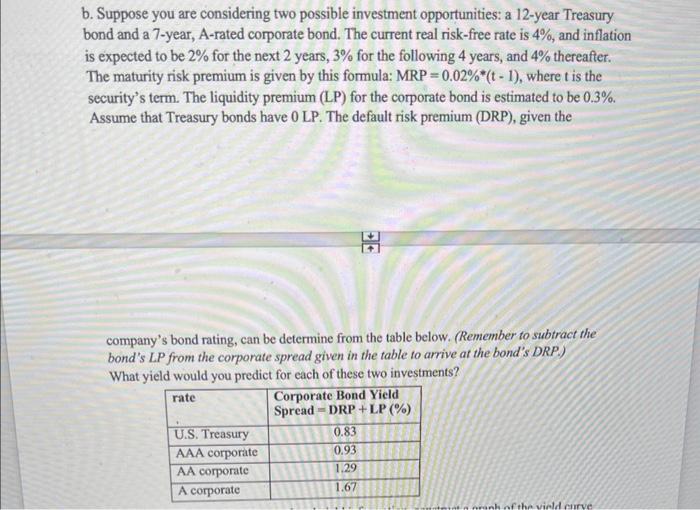
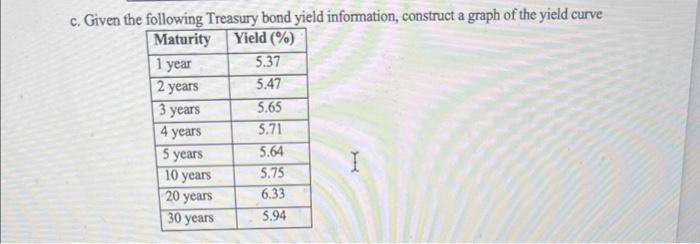

b. Suppose you are considering two possible investment opportunities: a 12-year Treasury bond and a 7-year, A-rated corporate bond. The current real risk-free rate is 4%, and inflation is expected to be 2% for the next 2 years, 3% for the following 4 years, and 4% thereafter. The maturity risk premium is given by this formula: MRP=0.02%(t1), where t is the security's term. The liquidity premium (LP) for the corporate bond is estimated to be 0.3%. Assume that Treasury bonds have 0LP. The default risk premium (DRP), given the company's bond rating, can be determine from the table below. (Remember to subtract the bond's LP from the corporate spread given in the table to arrive at the bond's DRP.) What yield would you predict for each of these two investments? c. Given the following Treasury bond yield information, construct a graph of the yield curve d. On the same graph from part (c) construct a new yield curve graph for the A-rated corporate bonds, based on the LP and DRP data for the corporate bond provided in part b. e. Which part of the yield curve (the left (S-T) side or right (LT) side) is likely to be most volatile over time? Please explain
Step by Step Solution
There are 3 Steps involved in it

Get step-by-step solutions from verified subject matter experts