

Question: This is the data below. 1. Consider the null hypothesis that the slope is 0. Test this hypothesis. The test statistic is: 2. For this
This is the data below. 1. Consider the null hypothesis that the slope is 0. Test this hypothesis. The test statistic is: 2. For this test, that the slope is 0, at the .05 level of significance you: (reject the null hypothesis, fail to reject the null hypothesis) 3. Consider the null hypothesis that the slope is 1. Test this hypothesis. The test statistic is: 4. For this test that the slope is 1, at the .05 level of significance you: 5. Provide the 95 percent confidence interval for the slope in regression
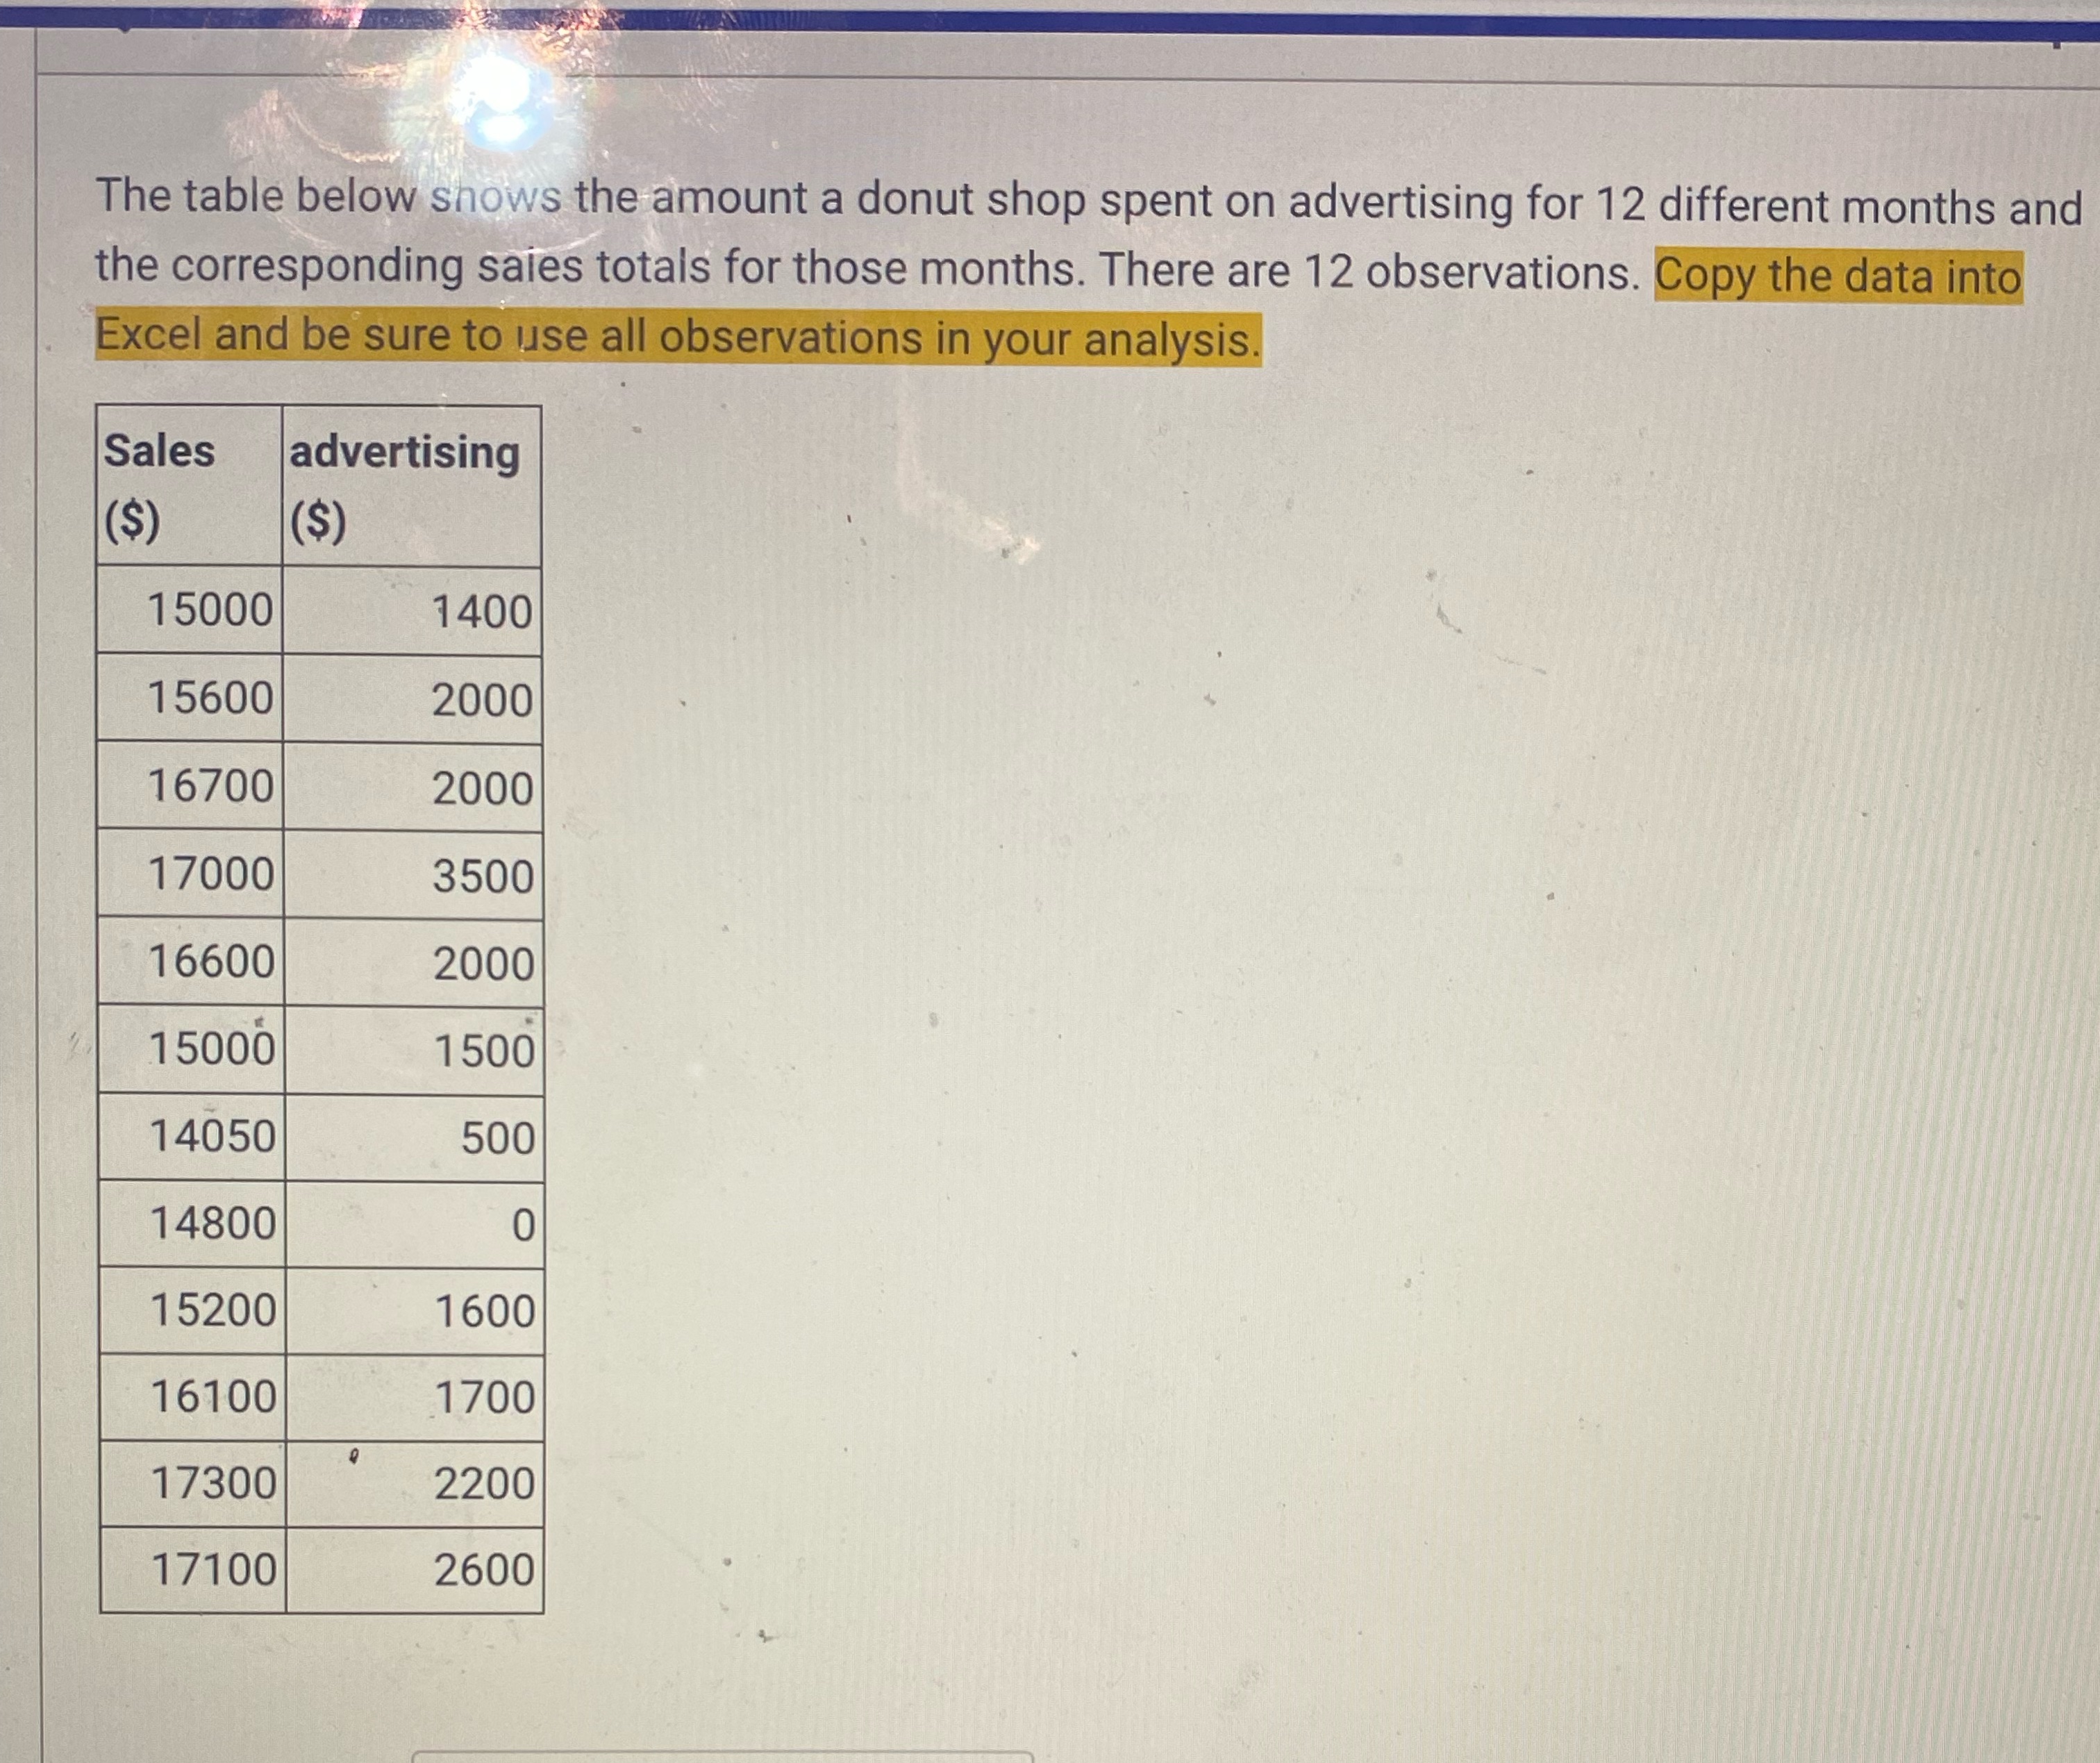
The table below shows the amount a donut shop spent on advertising for 12 different months and the corresponding sales totals for those months. There are 12 observations. Copy the data into Excel and be sure to use all observations in your analysis. Sales advertising ($) ($) 15000 1400 15600 2000 16700 2000 17000 3500 16600 2000 15000 1500 14050 500 14800 0 15200 1600 16100 1700 17300 2200 17100 2600
Step by Step Solution
There are 3 Steps involved in it

Get step-by-step solutions from verified subject matter experts