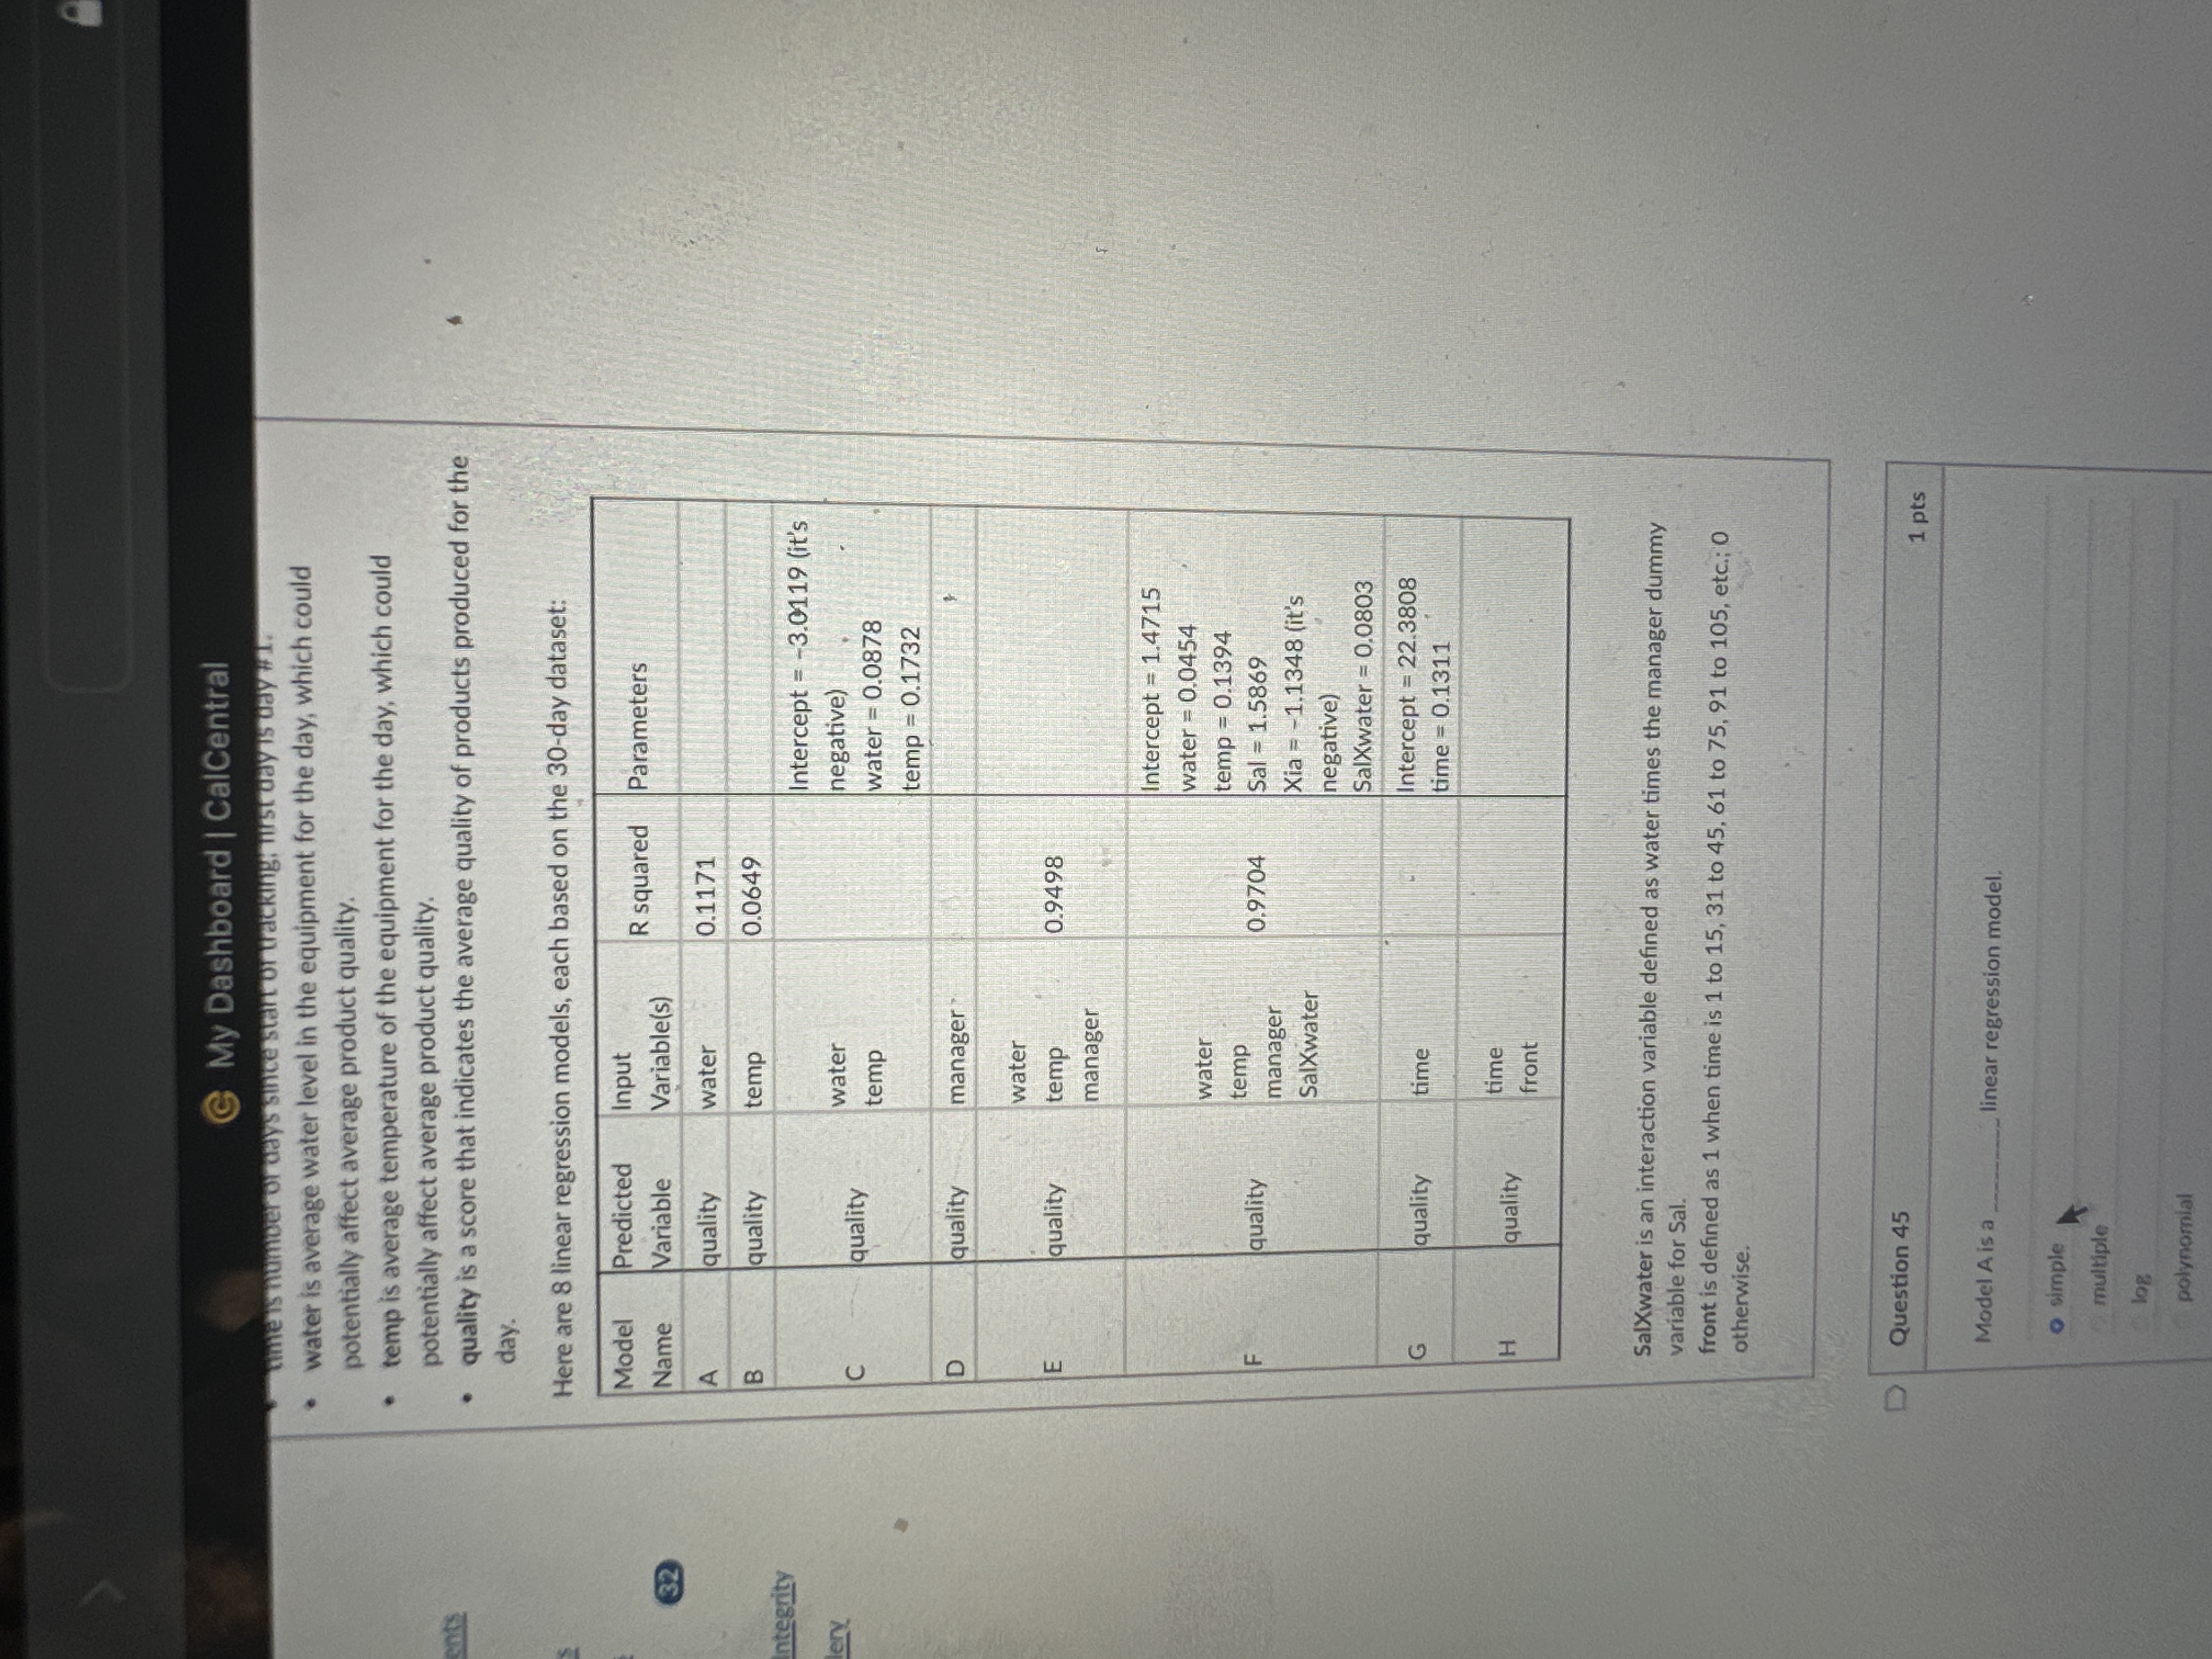
Question: This is the data My Dashboard | CalCentral time is number of days since start of tracking, first day is day # 1. water is

This is the data

This is the data My Dashboard | CalCentral time
My Dashboard | CalCentral time is number of days since start of tracking, first day is day # 1. water is average water level in the equipment for the day, which could potentially affect average product quality. temp is average temperature of the equipment for the day, which could potentially affect average product quality. eats quality is a score that indicates the average quality of products produced for the day. Here are 8 linear regression models, each based on the 30-day dataset: Model Predicted Input R squared Parameters 32 Name Variable Variable(s) A quality water 0.1171 R quality temp 0.0649 integrity Intercept = -3.0119 (it's lery water negative) C quality temp water = 0.0878 temp = 0.1732 D quality manager water E quality temp 0.9498 manager Intercept = 1.4715 water water = 0.0454 F temp temp = 0.1394 quality 0.9704 manager Sal = 1.5869 SalXwater Xia = -1.1348 (it's negative) Saltwater = 0.0803 G quality time Intercept = 22.3808 time = 0.1311 H time quality front SalXwater is an interaction variable defined as water times the manager dummy variable for Sal. front is defined as 1 when time is 1 to 15, 31 to 45, 61 to 75, 91 to 105, etc.; 0 otherwise. D Question 45 1 pts Model A is a linear regression model. o simple multiple log polynomial

Step by Step Solution

There are 3 Steps involved in it

1 Expert Approved Answer
Step: 1 Unlock blur-text-image
Question Has Been Solved by an Expert!

Get step-by-step solutions from verified subject matter experts

Step: 2 Unlock
Step: 3 Unlock

Students Have Also Explored These Related Mathematics Questions!