

Question: This is the data needs is APPL year return between 01/04/2021 to 12/30/2022 I have two goals for this project: 1. To help you master
![tradeoff for several measures of risk Tasks Packages and Settings [1]: import](https://dsd5zvtm8ll6.cloudfront.net/si.experts.images/questions/2024/09/66f31e796136f_08066f31e78db43a.jpg)
![matplotlib.pyplot as plt import numpy as np import pandas as pd [2]:](https://dsd5zvtm8ll6.cloudfront.net/si.experts.images/questions/2024/09/66f31e7a0e145_08166f31e798e69f.jpg) This is the data needs
This is the data needs
is APPL year return between 01/04/2021 to 12/30/2022
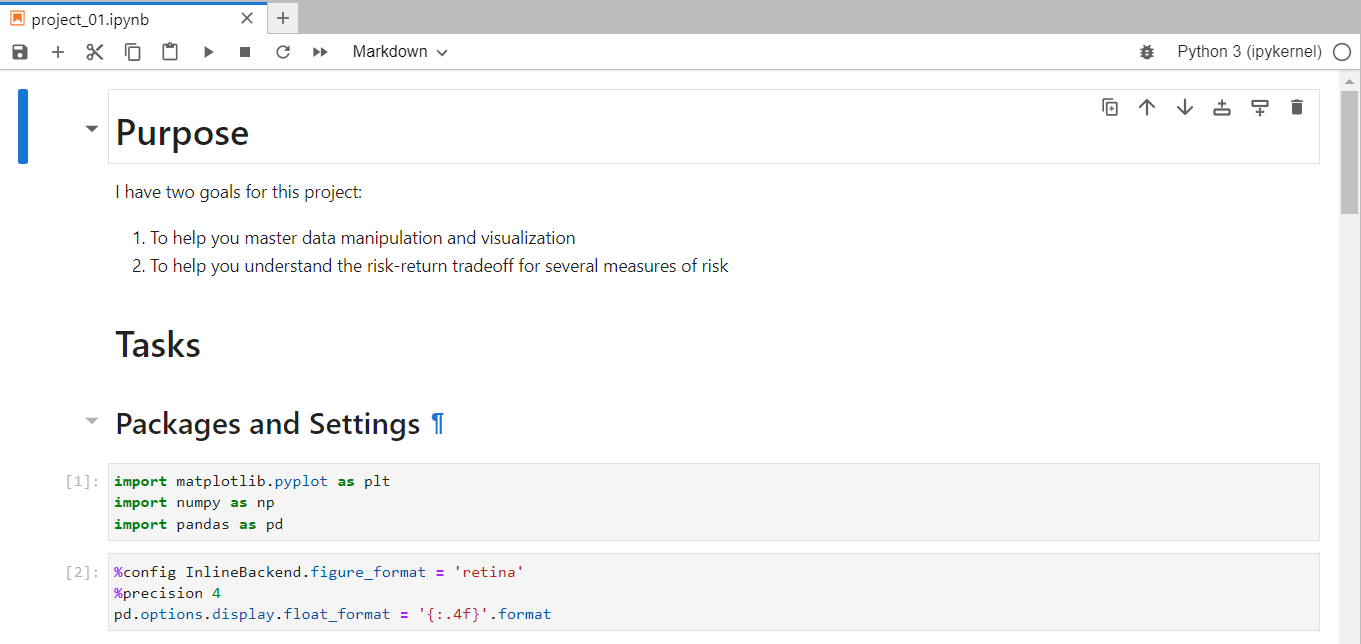
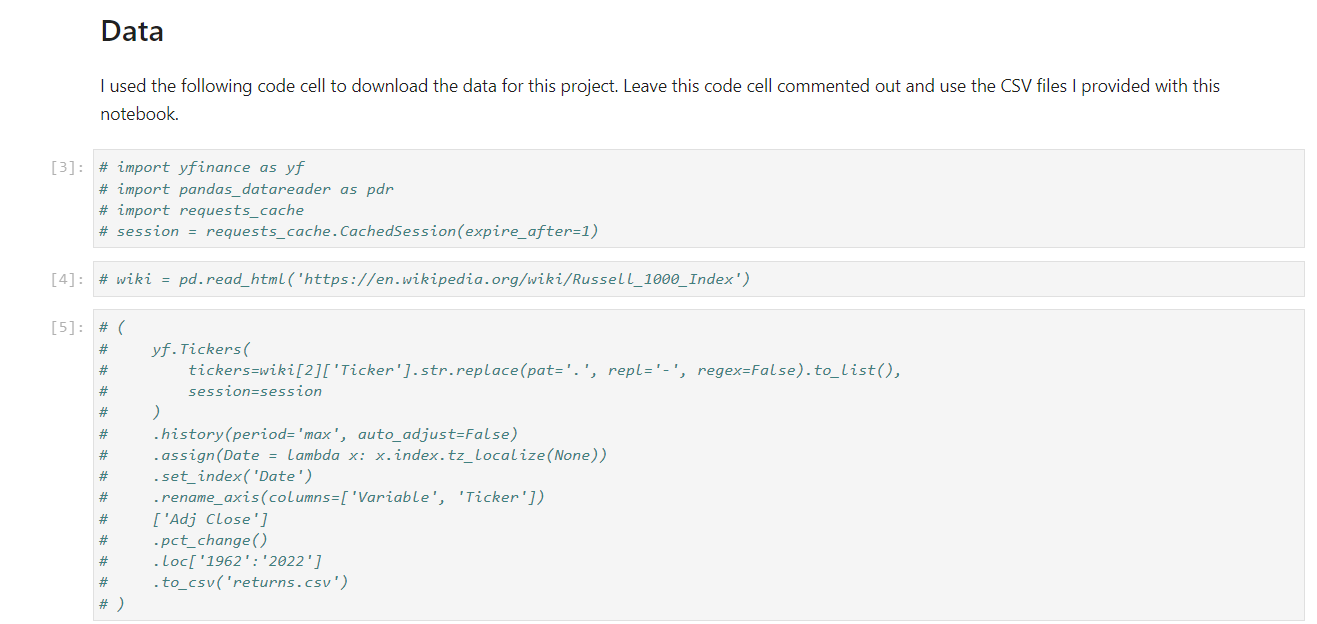
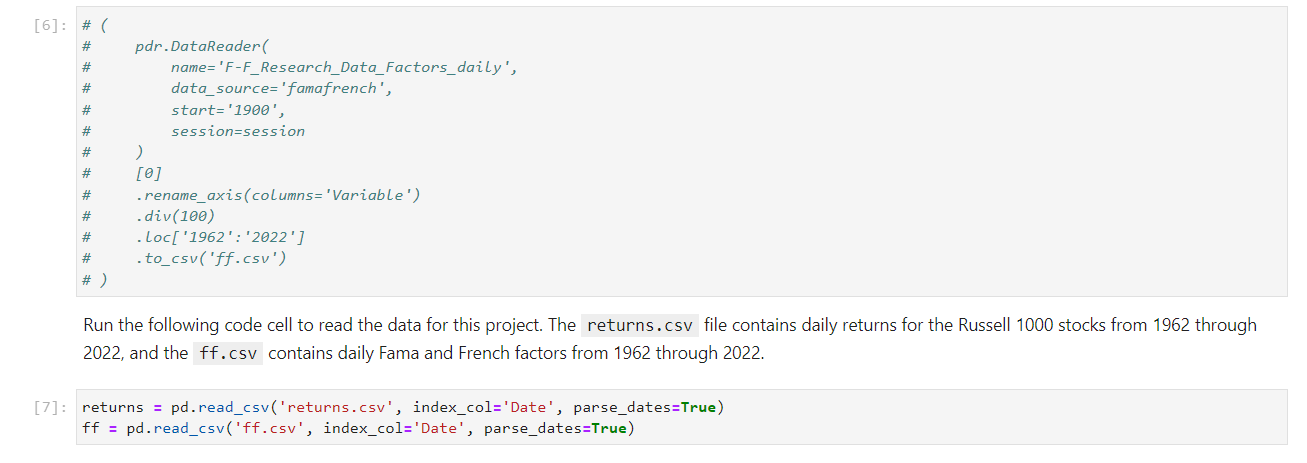
I have two goals for this project: 1. To help you master data manipulation and visualization 2. To help you understand the risk-return tradeoff for several measures of risk Tasks Packages and Settings [1]: import matplotlib.pyplot as plt import numpy as np import pandas as pd [2]: \%config InlineBackend. figure_format = 'retina' \%precision 4 pd.options.display.float_format ={:.4f} '.format Data I used the following code cell to download the data for this project. Leave this code cell commented out and use the CSV files I provided with this notebook. 3]: \# import yfinance as yf \# import pandas_datareader as pdr \# import requests_cache \# session = requests_cache.CachedSession (expire_after=1) 4]: \#wiki = pd.read_html('https://en.wikipedia.org/wiki/Russell_1000_Index') 5]: #( Run the following code cell to read the data for this project. The returns.csv file contains daily returns for the Russell 1000 stocks from 1962 through 2022, and the ff.csv contains daily Fama and French factors from 1962 through 2022. \[ \begin{array}{l} \text { returns }=\text { pd.read_csv('returns.csv', index_col='Date', parse_dates=True) } \\ f f=p d . r e a d \_c s v(' f f . c s v ' \text {, index_col='Date', parse_dates=True) } \end{array} \] Task 1: Do mean returns in year t predict mean returns in year t+1? Task 2: Does volatility in year t predict volatility in year t+1 ? Task 3: Do Sharpe Ratios in year t predict Sharpe Ratios in year t+1 ? Task 4: Do CAPM betas in year t predict CAPM betas in year t+1 ? Task 5: Does volatility in year t predict mean returns in year t+1 ? Task 6: Does CAPM beta in year t predict mean returns in year t+1 ? Portfolios 1 Task 7: Does volatility in year t predict mean returns in year t+1 ? Task 8: Does CAPM beta in year t predict mean returns in year t+1 ? Portfolios II the previous month. Equally weight these portfolios and rebalance them monthly. Task 9: Do high volatility portfolios have high mean returns and Sharpe Ratios? Discussion Task 10: Discuss and explain any limitations of your analysis above Run the following code cell to read the data for this project. The returns.csv file contains daily returns for the Russell 1000 stocks from 1962 through 2022, and the contains daily Fama and French factors from 1962 through 2022. \[ \begin{array}{l} \text { returns }=\text { pd.read_csv('returns.csv', index_col='Date' , parse_dates=True) } \\ f f=\text { pd.read_csv('ff.csv', index_col='Date', parse_dates=True) } \end{array} \] Single Stocks For this section, use the single stock returns in You may select years t and t+1, but only use stocks with complete returns data for years t and t+1. Task 1: Do mean returns in year t predict mean returns in year t+1 ? Task 2: Does volatility in year t predict volatility in year t+1? Task 3: Do Sharpe Ratios in year t predict Sharpe Ratios in year t+1 ? Task 4: Do CAPM betas in year t predict CAPM betas in year t+1? I have two goals for this project: 1. To help you master data manipulation and visualization 2. To help you understand the risk-return tradeoff for several measures of risk Tasks Packages and Settings [1]: import matplotlib.pyplot as plt import numpy as np import pandas as pd [2]: \%config InlineBackend. figure_format = 'retina' \%precision 4 pd.options.display.float_format ={:.4f} '.format Data I used the following code cell to download the data for this project. Leave this code cell commented out and use the CSV files I provided with this notebook. 3]: \# import yfinance as yf \# import pandas_datareader as pdr \# import requests_cache \# session = requests_cache.CachedSession (expire_after=1) 4]: \#wiki = pd.read_html('https://en.wikipedia.org/wiki/Russell_1000_Index') 5]: #( Run the following code cell to read the data for this project. The returns.csv file contains daily returns for the Russell 1000 stocks from 1962 through 2022, and the ff.csv contains daily Fama and French factors from 1962 through 2022. \[ \begin{array}{l} \text { returns }=\text { pd.read_csv('returns.csv', index_col='Date', parse_dates=True) } \\ f f=p d . r e a d \_c s v(' f f . c s v ' \text {, index_col='Date', parse_dates=True) } \end{array} \] Task 1: Do mean returns in year t predict mean returns in year t+1? Task 2: Does volatility in year t predict volatility in year t+1 ? Task 3: Do Sharpe Ratios in year t predict Sharpe Ratios in year t+1 ? Task 4: Do CAPM betas in year t predict CAPM betas in year t+1 ? Task 5: Does volatility in year t predict mean returns in year t+1 ? Task 6: Does CAPM beta in year t predict mean returns in year t+1 ? Portfolios 1 Task 7: Does volatility in year t predict mean returns in year t+1 ? Task 8: Does CAPM beta in year t predict mean returns in year t+1 ? Portfolios II the previous month. Equally weight these portfolios and rebalance them monthly. Task 9: Do high volatility portfolios have high mean returns and Sharpe Ratios? Discussion Task 10: Discuss and explain any limitations of your analysis above Run the following code cell to read the data for this project. The returns.csv file contains daily returns for the Russell 1000 stocks from 1962 through 2022, and the contains daily Fama and French factors from 1962 through 2022. \[ \begin{array}{l} \text { returns }=\text { pd.read_csv('returns.csv', index_col='Date' , parse_dates=True) } \\ f f=\text { pd.read_csv('ff.csv', index_col='Date', parse_dates=True) } \end{array} \] Single Stocks For this section, use the single stock returns in You may select years t and t+1, but only use stocks with complete returns data for years t and t+1. Task 1: Do mean returns in year t predict mean returns in year t+1 ? Task 2: Does volatility in year t predict volatility in year t+1? Task 3: Do Sharpe Ratios in year t predict Sharpe Ratios in year t+1 ? Task 4: Do CAPM betas in year t predict CAPM betas in year t+1
Step by Step Solution
There are 3 Steps involved in it

Get step-by-step solutions from verified subject matter experts