

Question: this is the data trt y ordinary 30 ordinary 36 ordinary 66 ordinary 21 ordinary 63 ordinary 38 ordinary 35 ordinary 45 antibacterial 76 antibacterial
this is the data
trt y ordinary 30 ordinary 36 ordinary 66 ordinary 21 ordinary 63 ordinary 38 ordinary 35 ordinary 45 antibacterial 76 antibacterial 27 antibacterial 42 antibacterial 30 antibacterial 26 antibacterial 46 antibacterial 6
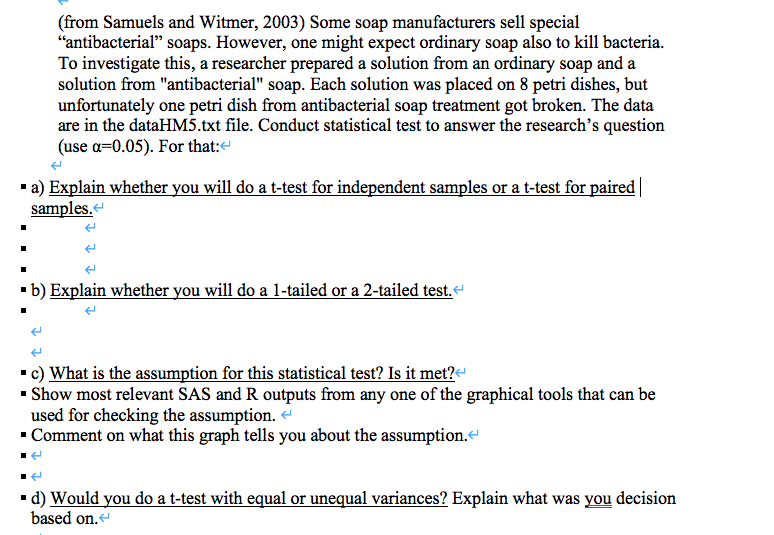
(from Samuels and Witmer, 2003) Some soap manufacturers sell special "antibacterial soaps. However, one might expect ordinary soap also to kill bacteria. To investigate this, a researcher prepared a solution from an ordinary soap and a solution from "antibacterial" soap. Each solution was placed on 8 petri dishes, but unfortunately one petri dish from antibacterial soap treatment got broken. The data are in the dataHM5.txt file. Conduct statistical test to answer the research's question (use a=0.05). For that: - a) Explain whether you will do a t-test for independent samples or a t-test for paired samples. b) Explain whether you will do a 1-tailed or a 2-tailed test. c) What is the assumption for this statistical test? Is it met? . Show most relevant SAS and R outputs from any one of the graphical tools that can be used for checking the assumption. Comment on what this graph tells you about the assumption. d) Would you do a t-test with equal or unequal variances? Explain what was you decision based on. (from Samuels and Witmer, 2003) Some soap manufacturers sell special "antibacterial soaps. However, one might expect ordinary soap also to kill bacteria. To investigate this, a researcher prepared a solution from an ordinary soap and a solution from "antibacterial" soap. Each solution was placed on 8 petri dishes, but unfortunately one petri dish from antibacterial soap treatment got broken. The data are in the dataHM5.txt file. Conduct statistical test to answer the research's question (use a=0.05). For that: - a) Explain whether you will do a t-test for independent samples or a t-test for paired samples. b) Explain whether you will do a 1-tailed or a 2-tailed test. c) What is the assumption for this statistical test? Is it met? . Show most relevant SAS and R outputs from any one of the graphical tools that can be used for checking the assumption. Comment on what this graph tells you about the assumption. d) Would you do a t-test with equal or unequal variances? Explain what was you decision based on
Step by Step Solution
There are 3 Steps involved in it

Get step-by-step solutions from verified subject matter experts