

Question: This is the example Draw a supply and demand graph similar to the example for each scenario. Label each axis and each demand and supply

This is the example
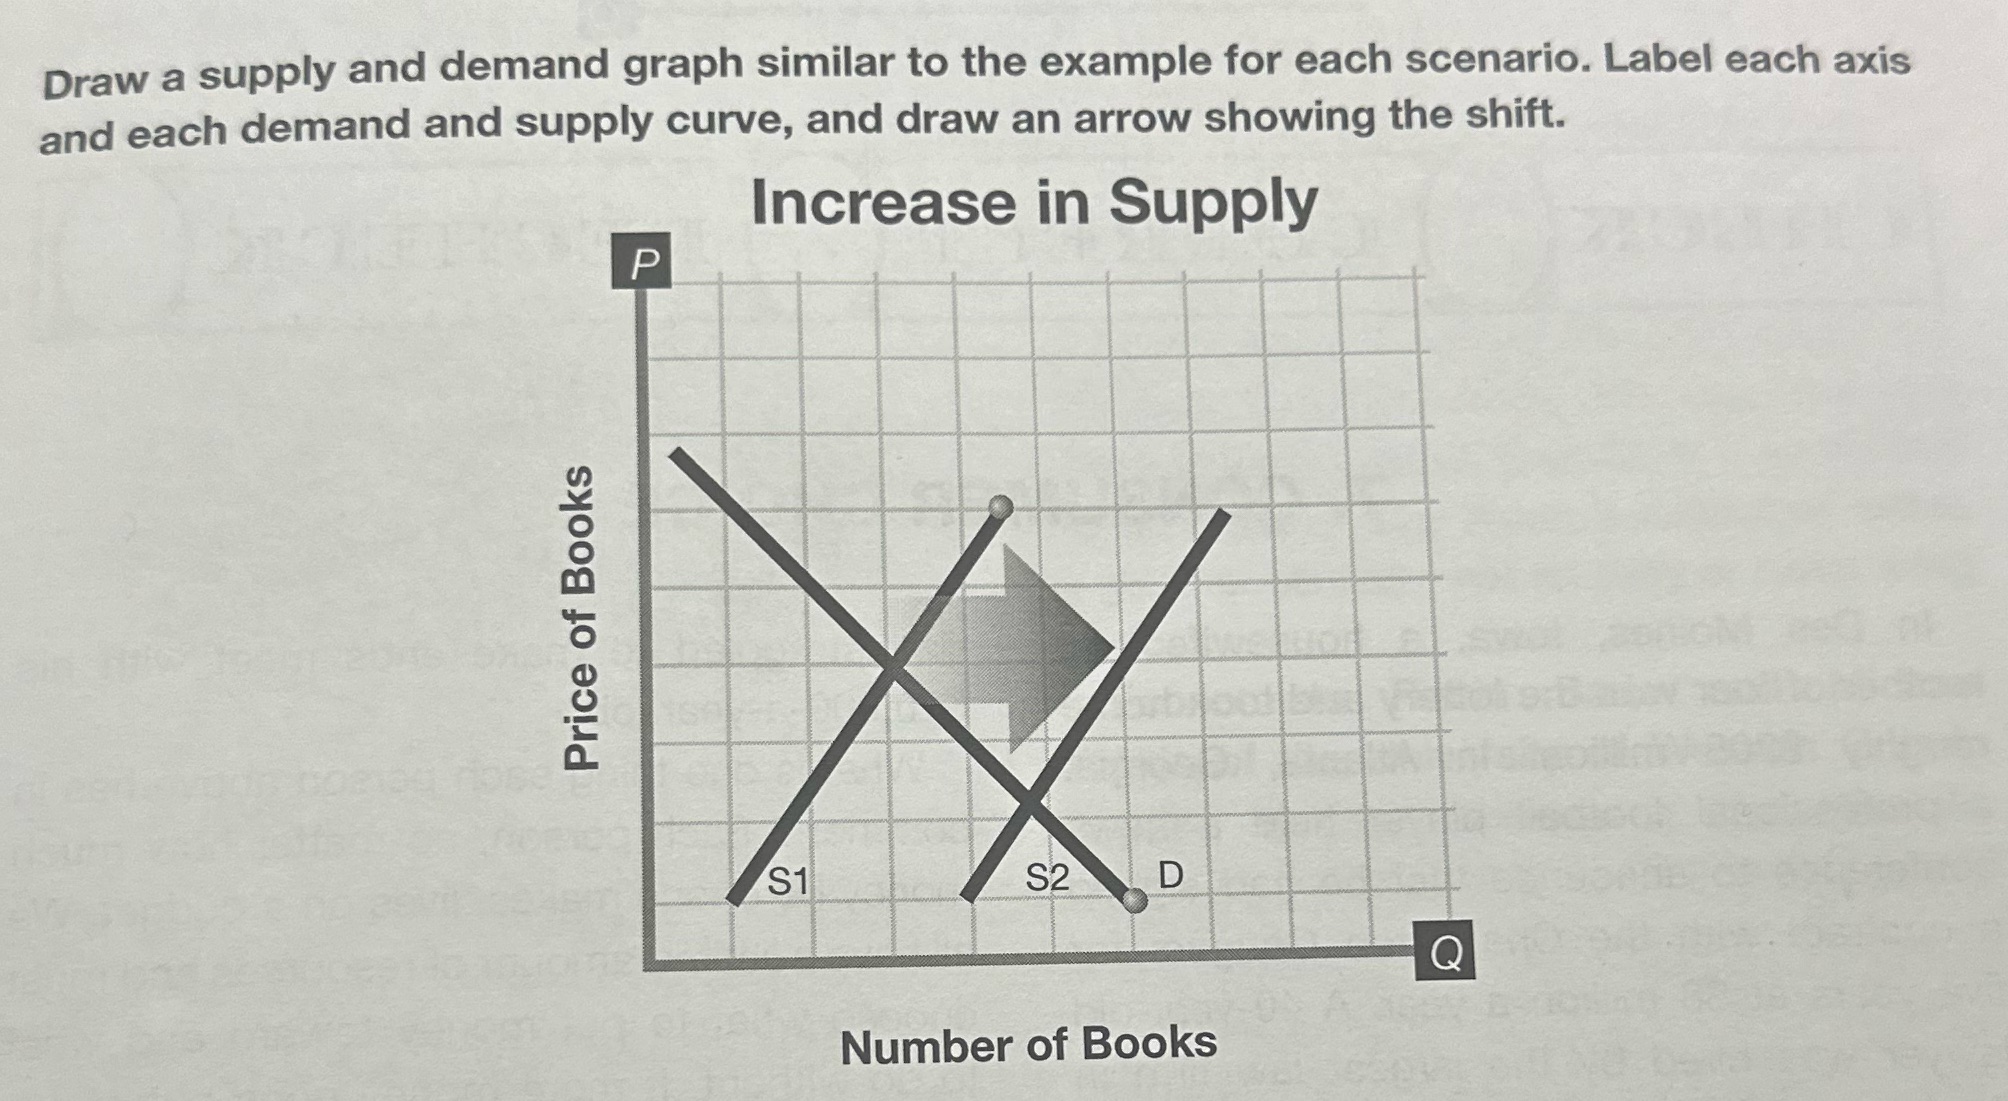
Draw a supply and demand graph similar to the example for each scenario. Label each axis and each demand and supply curve, and draw an arrow showing the shift. Increase in Supply P Price of Books S1 S2 D Q Number of Books
Step by Step Solution
There are 3 Steps involved in it
1 Expert Approved Answer
Step: 1 Unlock

Question Has Been Solved by an Expert!
Get step-by-step solutions from verified subject matter experts
Step: 2 Unlock
Step: 3 Unlock