

Question: This is the full question: A storm has developed and we would like to estimate its intensity. Our afternoon radiosonde observed the environmental temperature profile
This is the full question:
A storm has developed and we would like to estimate its intensity. Our afternoon radiosonde observed the environmental temperature profile shown on the following page. (the skew-t chart below) 1. Draw the temperature profile of a parcel ascending from 1000 hPa to 100 hPa with an initial temperature of 25?C and a dew point temperature of 1?C. 2. Identify and label the LCL, LFC, EL, and any inversion layers. 3. Draw the convective inhibition (CIN) on the skew-T diagram. What temperature would our parcel need to be to overcome this CIN? 4. Draw the convective available potential energy (CAPE) on the skew-T diagram and estimate the CAPE for this storm. 5. Classify the type of convection and list the typical observed updraft velocities for this type of convection.
Can you please follow the steps below to solve this problem
To draw the temperature profile of a parcel ascending from 1000 hPa to 100 hPa with an initial temperature of 25C and a dew point temperature of 1C, we need to follow the adiabatic lapse rate until the parcel temperature intersects the dew point temperature line.
The adiabatic lapse rate for a dry parcel is approximately 10C per 1000 meters or 1C per 100 meters. However, when the parcel becomes saturated, the adiabatic lapse rate reduces to approximately 6C per 1000 meters or 0.6C per 100 meters.
Assuming the initial pressure of the parcel is 1000 hPa, we can use the following steps to draw the temperature profile:
- Draw a horizontal line from 25C on the left-hand side of the graph to the right until it intersects the 1000 hPa pressure line.
- Draw a diagonal line from the intersection point to the left, following the adiabatic lapse rate of 1C per 100 meters until it intersects the dew point temperature line at approximately 400 hPa.
- Draw a horizontal line from the intersection point to the left until it intersects the 400 hPa pressure line.
- Draw a diagonal line from the intersection point to the left, following the adiabatic lapse rate of 0.6C per 100 meters until it intersects the 100 hPa pressure line.
The resulting temperature profile of the ascending parcel should be a curve that starts at 25C and decreases slowly at first and then more rapidly as it approaches the dew point temperature line, and then continues to decrease at a slower rate until it reaches approximately -24C at 100 hPa
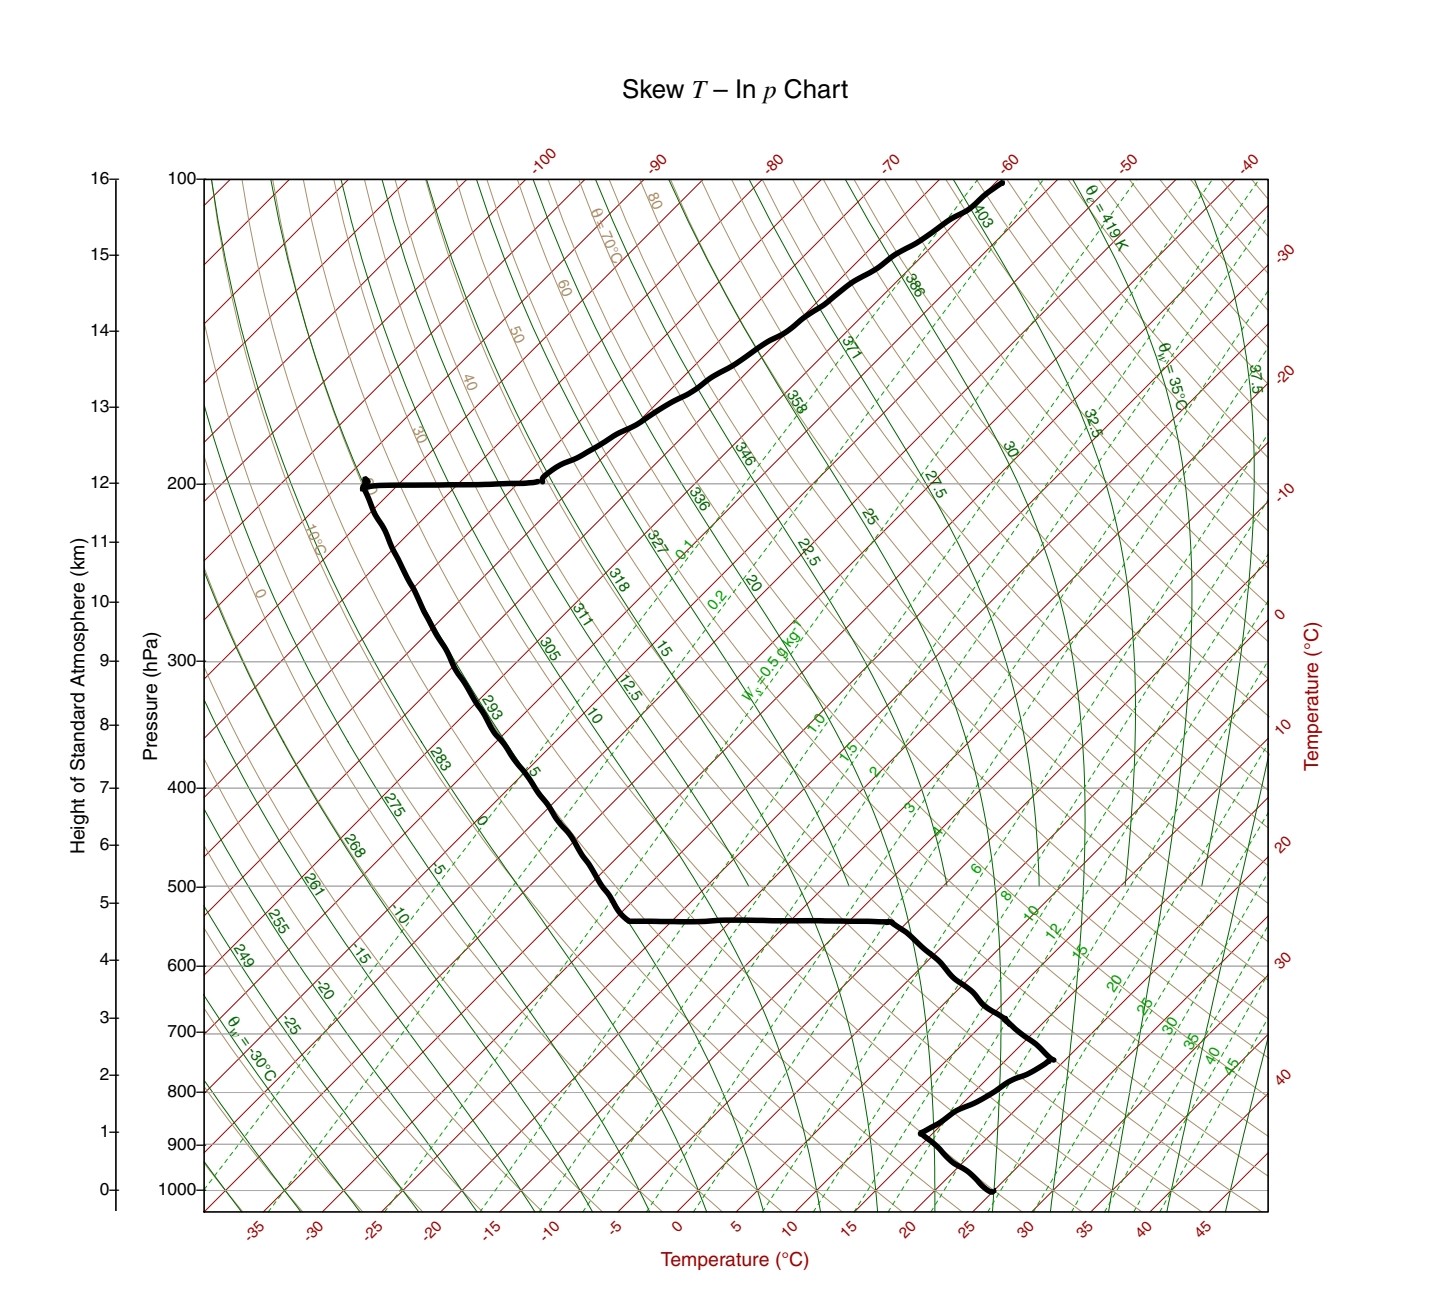
Skew T- In p Chart 167 100- 100 -90 .80 60 -50 -40 15- coV 1610 =P0 14- 30 13- 20 12- 200- :11- 300- Height of Standard Atmosphere (km) Pressure (hPa) 8621 Temperature (C) 1283 400- 275 268 5- 500- 190 20 255 600- 3- 700- 30 2- 800- 1-+ 900- 1000- 30 20 15 15 20 25 Temperature (C) 30
Step by Step Solution
There are 3 Steps involved in it

Get step-by-step solutions from verified subject matter experts