

Question: This is the only info I have As a second assignment, you are requested to forecast monthly demand for ETFs (Exchange-Traded Funds). See, table: Month
This is the only info I have 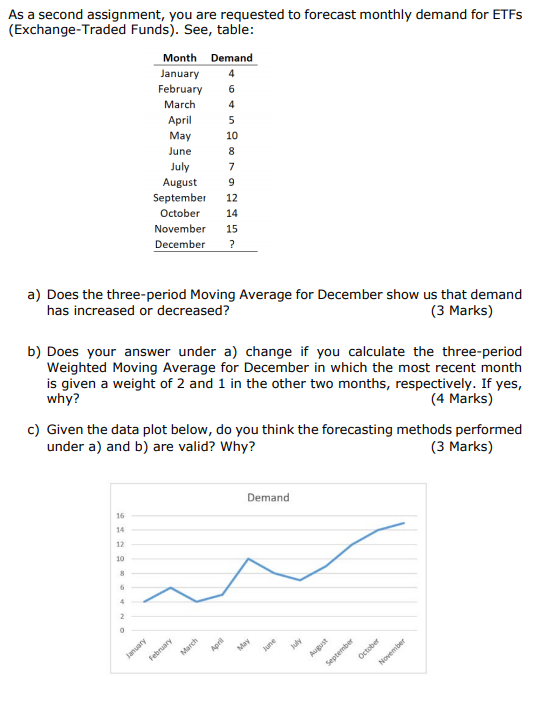
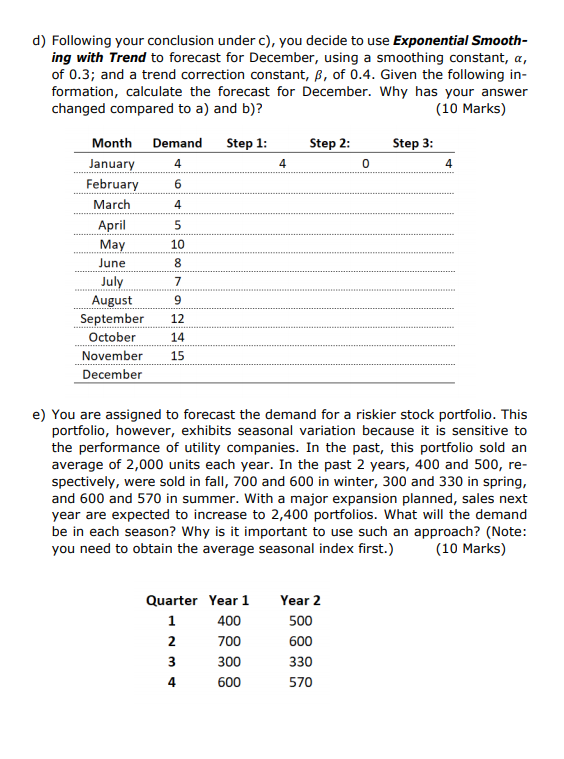
As a second assignment, you are requested to forecast monthly demand for ETFs (Exchange-Traded Funds). See, table: Month Demand January 4 February 6 March 4 April 5 May 10 June 8 July August 9 September 12 October 14 November 15 December ? a) Does the three-period Moving Average for December show us that demand has increased or decreased? (3 Marks) b) Does your answer under a) change if you calculate the three-period Weighted Moving Average for December in which the most recent month is given a weight of 2 and 1 in the other two months, respectively. If yes, why? (4 Marks) c) Given the data plot below, do you think the forecasting methods performed under a) and b) are valid? Why? (3 Marks) Demand 16 14 12 10 4 2 Avenue March April May October September February Novembe d) Following your conclusion under c), you decide to use Exponential Smooth- ing with Trend to forecast for December, using a smoothing constant, a, of 0.3; and a trend correction constant, B, of 0.4. Given the following in- formation, calculate the forecast for December. Why has your answer changed compared to a) and b)? (10 Marks) Step 1: Step 2: Step 3: 4 0 4 Month Demand January 4 February 6 March 4 April 5 May 10 June 8 July 7 August 9 September 12 October 14 November 15 December e) You are assigned to forecast the demand for a riskier stock portfolio. This portfolio, however, exhibits seasonal variation because it is sensitive to the performance of utility companies. In the past, this portfolio sold an average of 2,000 units each year. In the past 2 years, 400 and 500, re- spectively, were sold in fall, 700 and 600 in winter, 300 and 330 in spring, and 600 and 570 in summer. With a major expansion planned, sales next year are expected to increase to 2,400 portfolios. What will the demand be in each season? Why is it important to use such an approach? (Note: you need to obtain the average seasonal index first.) (10 Marks) Quarter Year 1 1 400 2 700 3 300 600 Year 2 500 600 330 570 4 As a second assignment, you are requested to forecast monthly demand for ETFs (Exchange-Traded Funds). See, table: Month Demand January 4 February 6 March 4 April 5 May 10 June 8 July August 9 September 12 October 14 November 15 December ? a) Does the three-period Moving Average for December show us that demand has increased or decreased? (3 Marks) b) Does your answer under a) change if you calculate the three-period Weighted Moving Average for December in which the most recent month is given a weight of 2 and 1 in the other two months, respectively. If yes, why? (4 Marks) c) Given the data plot below, do you think the forecasting methods performed under a) and b) are valid? Why? (3 Marks) Demand 16 14 12 10 4 2 Avenue March April May October September February Novembe d) Following your conclusion under c), you decide to use Exponential Smooth- ing with Trend to forecast for December, using a smoothing constant, a, of 0.3; and a trend correction constant, B, of 0.4. Given the following in- formation, calculate the forecast for December. Why has your answer changed compared to a) and b)? (10 Marks) Step 1: Step 2: Step 3: 4 0 4 Month Demand January 4 February 6 March 4 April 5 May 10 June 8 July 7 August 9 September 12 October 14 November 15 December e) You are assigned to forecast the demand for a riskier stock portfolio. This portfolio, however, exhibits seasonal variation because it is sensitive to the performance of utility companies. In the past, this portfolio sold an average of 2,000 units each year. In the past 2 years, 400 and 500, re- spectively, were sold in fall, 700 and 600 in winter, 300 and 330 in spring, and 600 and 570 in summer. With a major expansion planned, sales next year are expected to increase to 2,400 portfolios. What will the demand be in each season? Why is it important to use such an approach? (Note: you need to obtain the average seasonal index first.) (10 Marks) Quarter Year 1 1 400 2 700 3 300 600 Year 2 500 600 330 570 4
Step by Step Solution
There are 3 Steps involved in it

Get step-by-step solutions from verified subject matter experts