

Question: This is the problem I'm having trouble with. The red squares are the ones I got incorrect. Condensed balance sheet and income statement data for
This is the problem I'm having trouble with. The red squares are the ones I got incorrect.
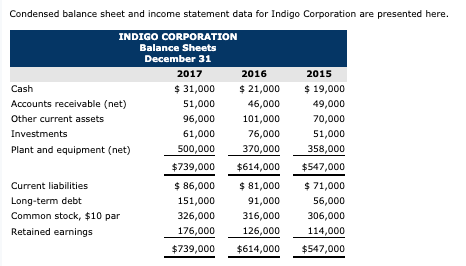


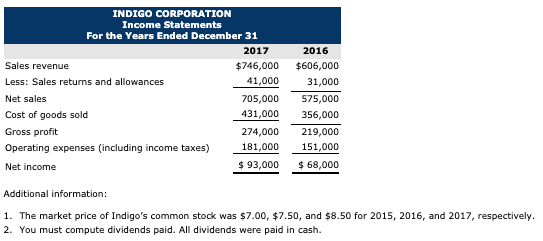
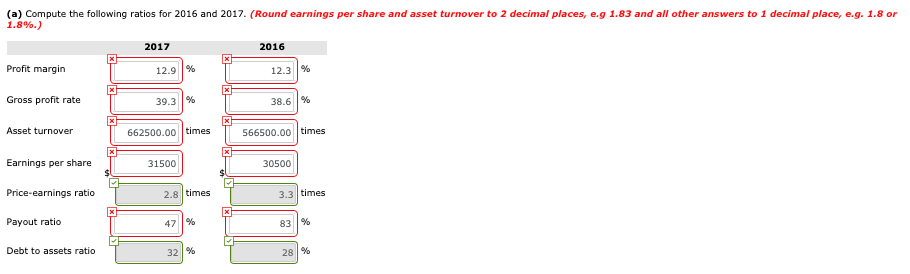
Condensed balance sheet and income statement data for Indigo Corporation are presented here. INDIGO CORPORATION Balance Sheets December 31 2017 2016 2015 Cash $ 31,000 $ 21,000 $ 19,000 Accounts receivable (net) 51,000 46,000 49,000 Other current assets 96,000 101,000 70,000 Investments 61,000 76,000 51,000 Plant and equipment (net) 500,000 370,000 358,000 $739,000 $614,000 $547,000 Current liabilities $ 86,000 $ 81,000 $ 71,000 Long-term debt 151,000 91,000 56,000 Common stock, $10 par 326,000 316,000 306,000 Retained earnings 176,000 126,000 114,000 $739,000 $614,000 $547,000INDIGO CORPORATION Income Statements For the Years Ended December 31 2017 2016 Sales revenue $746,000 $606,000 Less: Sales returns and allowances 41,000 31,000 Net sales 705,000 575,000 Cost of goods sold 431,000 356,000 Gross profit 274,000 219,000 Operating expenses (including income taxes) 181,000 151,000 Net income $ 93,000 $ 68,000 Additional information: 1. The market price of Indigo's common stock was $7.00, $7.50, and $8.50 for 2015, 2016, and 2017, respectively. 2. You must compute dividends paid. All dividends were paid in cash.(a) Compute the following ratios for 2016 and 2017. (Round earnings per share and asset turnover to 2 decimal places, e.g 1.83 and all other answers to 1 decimal place, e.g. 1.8 or 1.8%.) 2017 2016 Profit margin 12.9 12.3 Gross profit rate 39.3 38.6 Asset turnover 662500.00 times 566500.00 times Earnings per share 31500 30500 Price-earnings ratio 2.8 times 3.3 times X Payout ratio 47 83 Debt to assets ratio 32 No 28
Step by Step Solution
There are 3 Steps involved in it

Get step-by-step solutions from verified subject matter experts