

Question: This is the python skeleton: import pylab as py def open_file(): '''Remember to put a docstring here''' #input(Input a file name: ) #print(Unable to open
This is the python skeleton:
import pylab as py
def open_file():
'''Remember to put a docstring here'''
#input("Input a file name: ")
#print("Unable to open file. Please try again.")
pass
def update_dictionary(dictionary, year, hurricane_name, data):
'''Remember to put a docstring here'''
pass
def create_dictionary():
'''Remember to put a docstring here'''
pass
def display_table(dictionary, year):
'''Remember to put a docstring here'''
pass
#print("{:^70s}".format("Peak Wind Speed for the Hurricanes in " + year))
#print("{:15s}{:>15s}{:>20s}{:>15s}".format("Name","Coordinates","Wind Speed (knots)","Date"))
def get_years(dictionary):
'''Remember to put a docstring here'''
pass
def prepare_plot(dictionary, year):
'''Remember to put a docstring here'''
pass
# create everything that is required for plotting
#return names, coordinates, max_speed
def plot_map(year, size, names, coordinates):
'''Remember to put a docstring here'''
# The the RGB list of the background image
img = py.imread("world-map.jpg")
# Set the max values for the latitude and longitude of the map
max_longitude, max_latitude = 180, 90
# Set the background image on the plot
py.imshow(img,extent=[-max_longitude,max_longitude,\
-max_latitude,max_latitude])
# Set the corners of the map to cover the Atlantic Region
xshift = (50,190)
yshift = (90,30)
# Show the atlantic ocean region
py.xlim((-max_longitude+xshift[0],max_longitude-xshift[1]))
py.ylim((-max_latitude+yshift[0],max_latitude-yshift[1]))
# Generate the colormap and select the colors for each hurricane
cmap = py.get_cmap('gnuplot')
colors = [cmap(i/size) for i in range(size)]
# plot each hurricane's trajectory
for i,key in enumerate(names):
lat = [ lat for lat,lon in coordinates[i] ]
lon = [ lon for lat,lon in coordinates[i] ]
py.plot(lon,lat,color=colors[i],label=key)
# Set the legend at the bottom of the plot
py.legend(bbox_to_anchor=(0.,-0.5,1.,0.102),loc=0, ncol=3,mode='expand',\
borderaxespad=0., fontsize=10)
# Set the labels and titles of the plot
py.xlabel("Longitude (degrees)")
py.ylabel("Latitude (degrees)")
py.title("Hurricane Trayectories for {}".format(year))
py.show() # show the full map
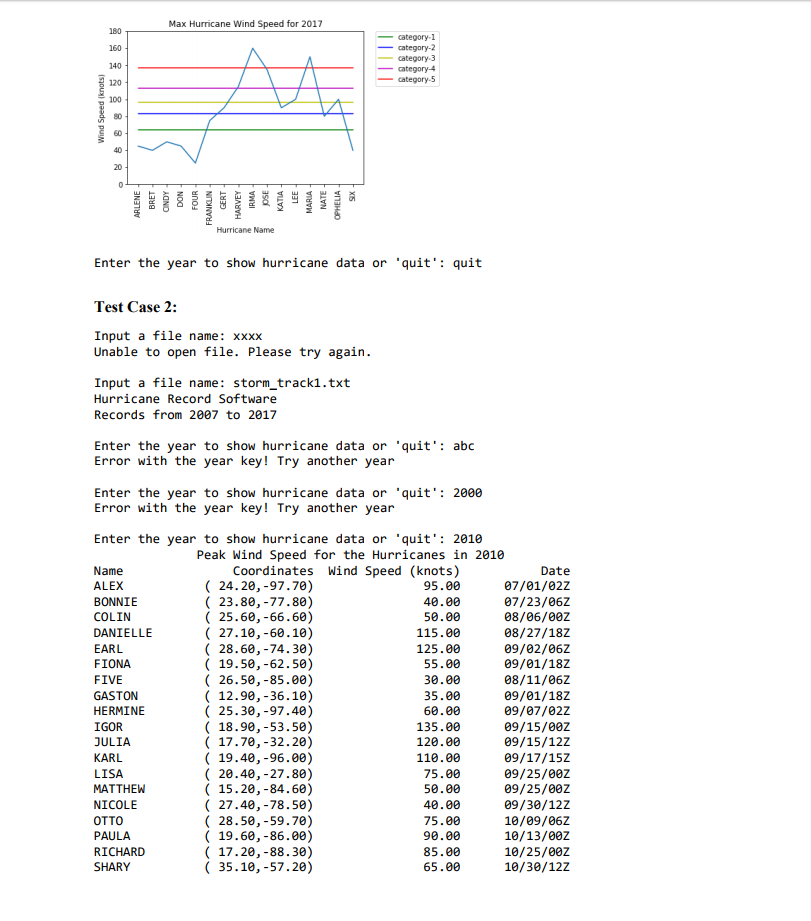
def plot_wind_chart(year,size,names,max_speed):
'''Remember to put a docstring here'''
# Set the value of the category
cat_limit = [ [v for i in range(size)] for v in [64,83,96,113,137] ]
# Colors for the category plots
COLORS = ["g","b","y","m","r"]
# Plot the Wind Speed of Hurricane
for i in range(5):
py.plot(range(size),cat_limit[i],COLORS[i],label="category-{:d}".format(i+1))
# Set the legend for the categories
py.legend(bbox_to_anchor=(1.05, 1.),loc=2,\
borderaxespad=0., fontsize=10)
py.xticks(range(size),names,rotation='vertical') # Set the x-axis to be the names
py.ylim(0,180) # Set the limit of the wind speed
# Set the axis labels and title
py.ylabel("Wind Speed (knots)")
py.xlabel("Hurricane Name")
py.title("Max Hurricane Wind Speed for {}".format(year))
py.plot(range(size),max_speed) # plot the wind speed plot
py.show() # Show the plot
def main():
'''Remember to put a docstring here'''
#print("Hurricane Record Software")
#print("Records from {:4s} to {:4s}".format(min_year, max_year))
#input("Enter the year to show hurricane data or 'quit': ")
#input(" Do you want to plot? ")
#names, coordinates, max_speed = prepare_plot(dictionary, year)
#plot_map(year, size, names, coordinates)
#plot_wind_chart(year, size, names, max_speed)
#print("Error with the year key! Try another year")
pass
if __name__ == "__main__":
main()
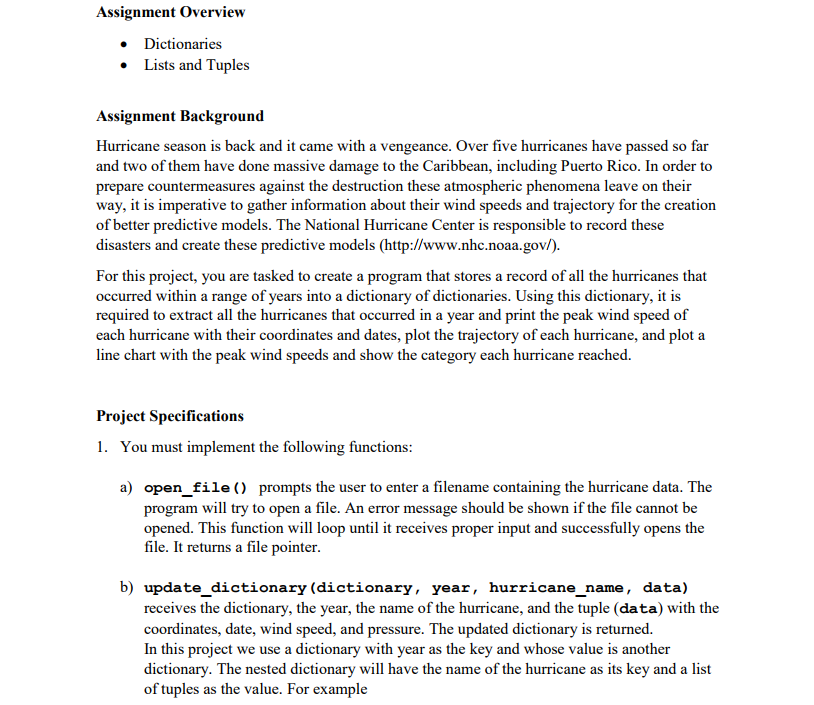
Assignment Overview Dictionaries Lists and Tuples Assignment Background Hurricane season is back and it came with a vengeance. Over five hurricanes have passed so far and two of them have done massive damage to the Caribbean, including Puerto Rico. In order to prepare countermeasures against the destruction these atmospheric phenomena leave on their way, it is imperative to gather information about their wind speeds and trajectory for the creation of better predictive models. The National Hurricane Center is responsible to record these disasters and create these predictive models (http://www.nhc.noaa.gov/). For this project, you are tasked to create a program that stores a record of all the hurricanes that occurred within a range of years into a dictionary of dictionaries. Using this dictionary, it is required to extract all the hurricanes that occurred in a year and print the peak wind speed of each hurricane with their coordinates and dates, plot the trajectory of each hurricane, and plot a line chart with the peak wind speeds and show the category each hurricane reached. Project Specifications 1. You must implement the following functions a) open file) prompts the user to enter a filename containing the hurricane data. The program will try to open a file. An error message should be shown if the file cannot be opened. This function will loop until it receives proper input and successfully opens the file. It returns a file pointer b) update dictionary (dictionary, year, hurricane name, data) receives the dictionary, the year, the name of the hurricane, and the tuple (data) with the coordinates, date, wind speed, and pressure. The updated dictionary is returned. In this project we use a dictionary with year as the key and whose value is another dictionary. The nested dictionary will have the name of the hurricane as its key and a list of tuples as the value. For example
Step by Step Solution
There are 3 Steps involved in it

Get step-by-step solutions from verified subject matter experts