

Question: This is the question and the graph 6. Consider again the data shown in Table 12-20. Compute 95% confidence intervals for the mean price of
This is the question and the graph
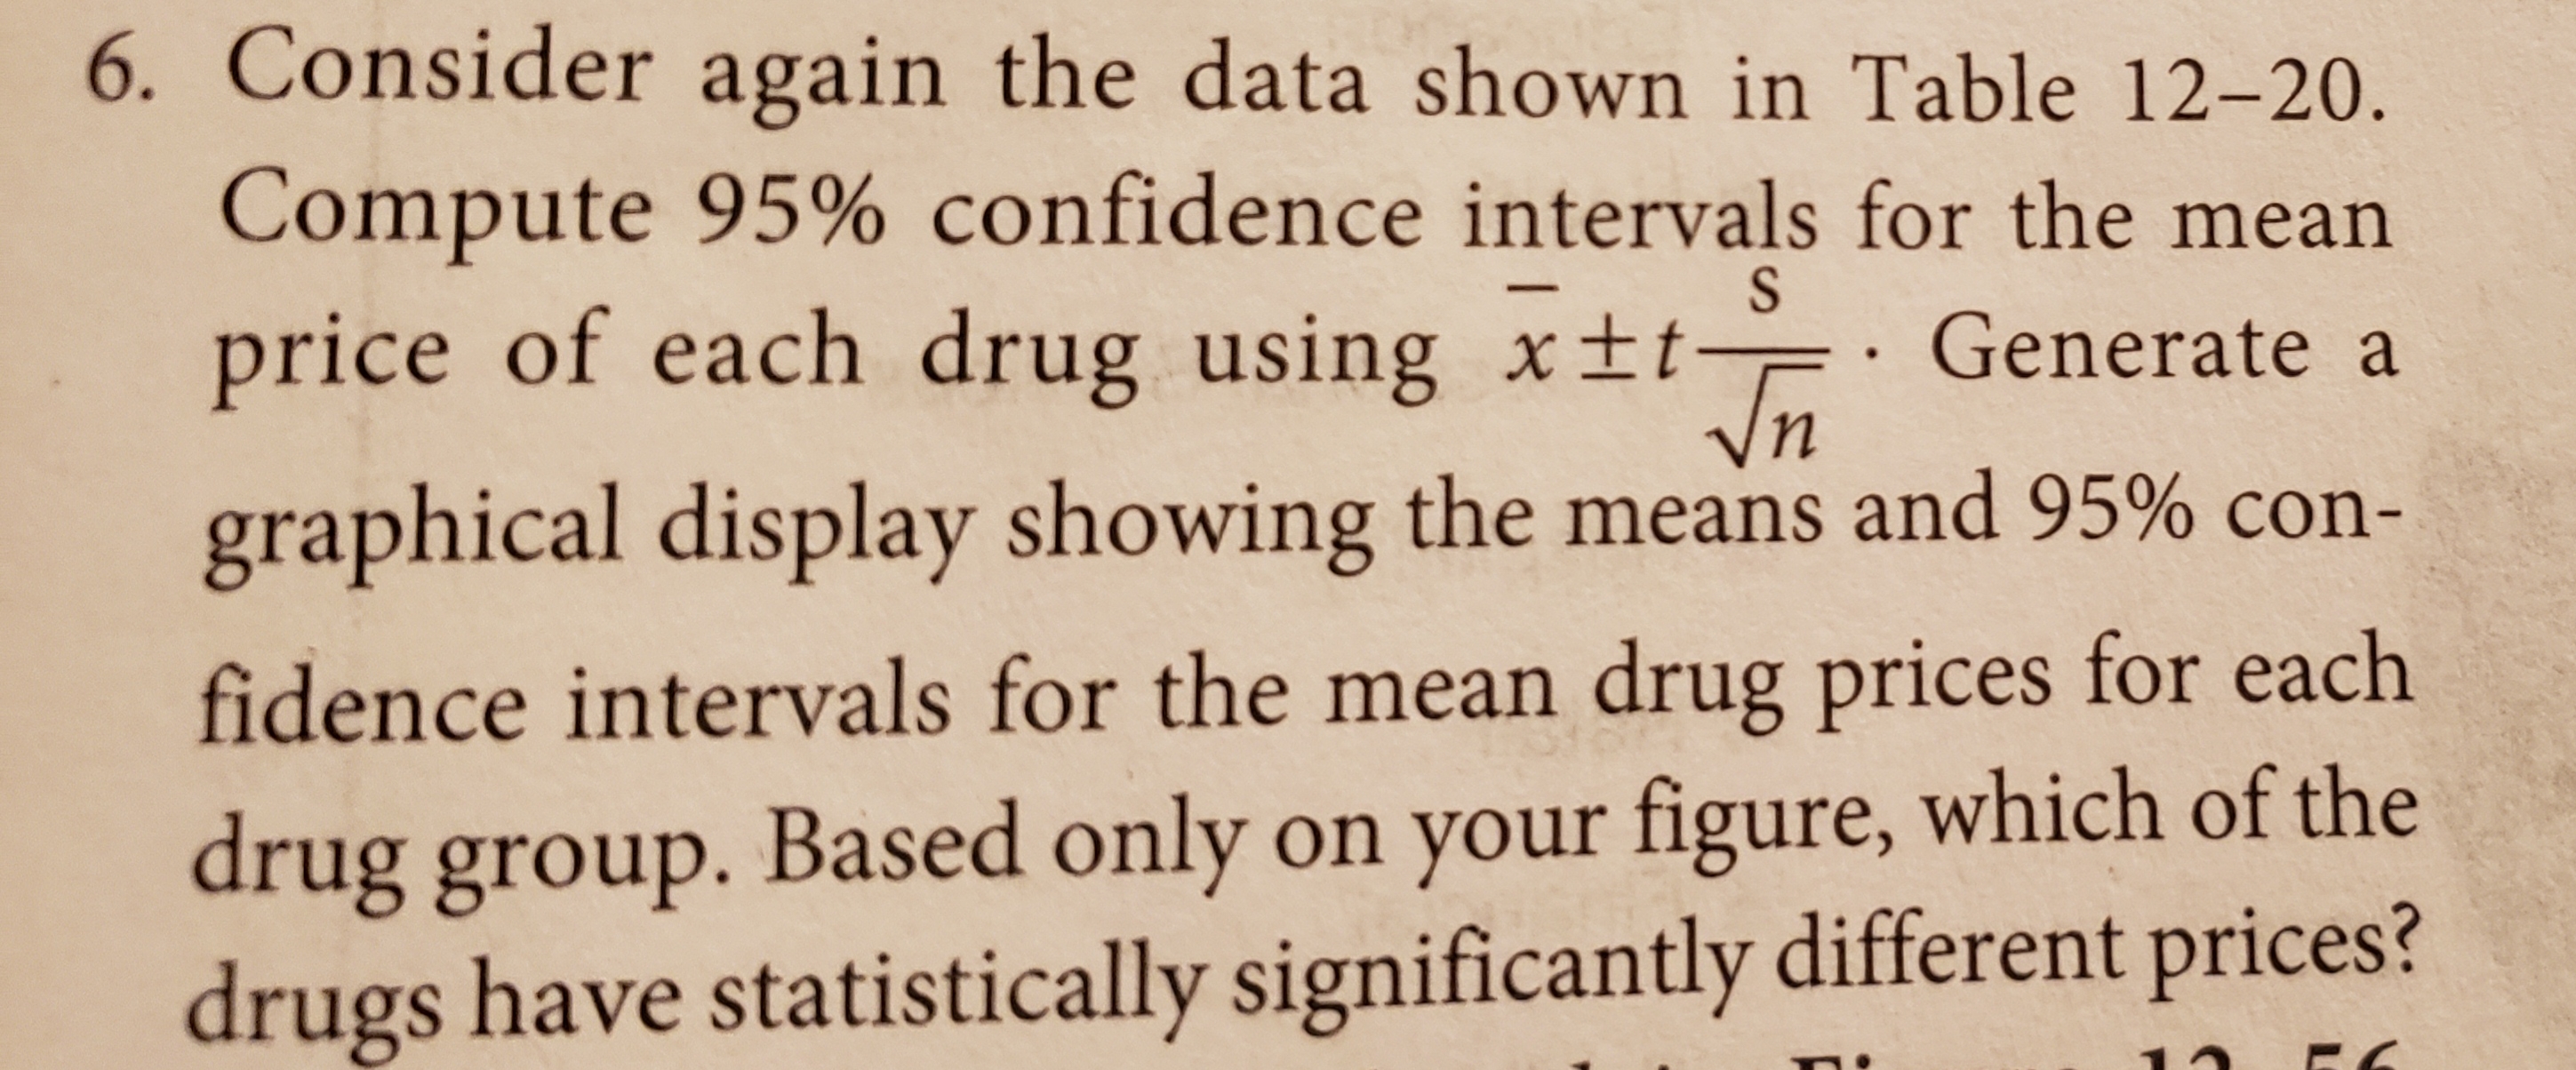
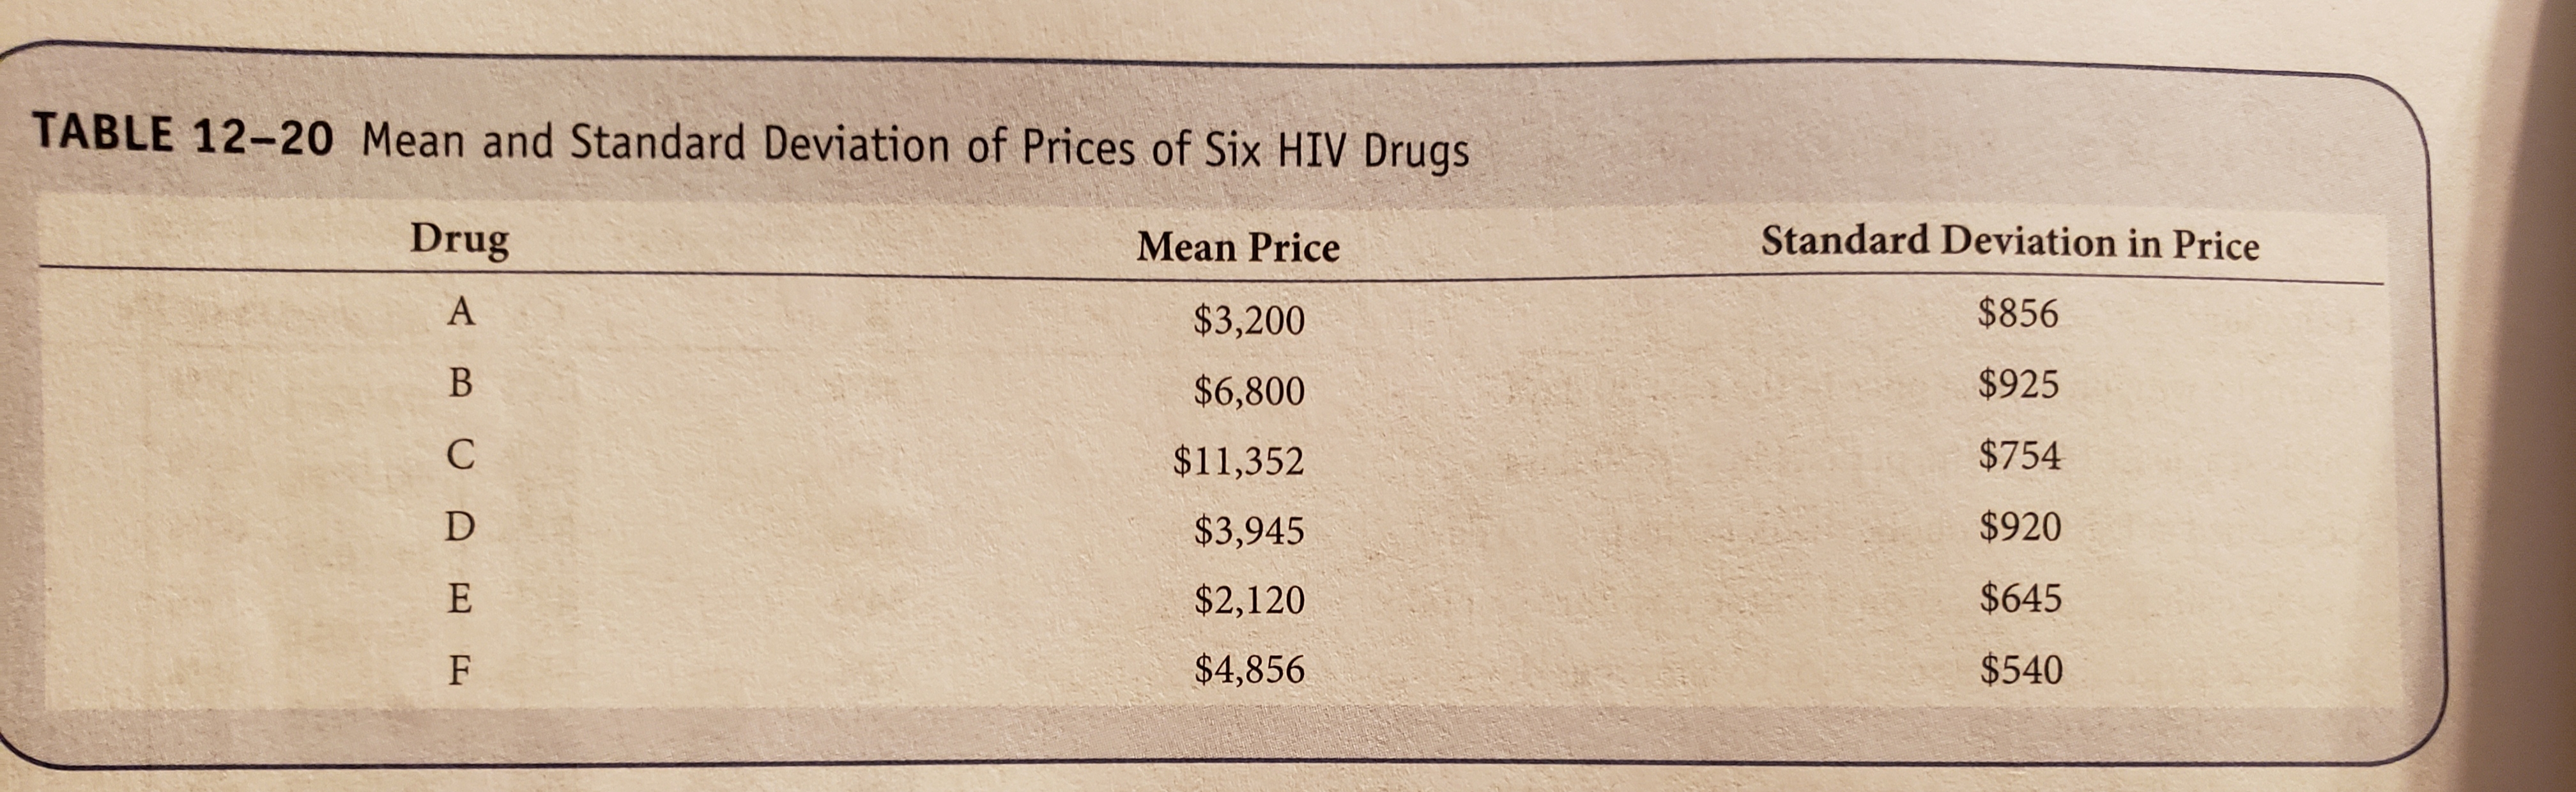
6. Consider again the data shown in Table 12-20. Compute 95% confidence intervals for the mean price of each drug using xit S . Generate a Vn graphical display showing the means and 95% con- fidence intervals for the mean drug prices for each drug group. Based only on your figure, which of the drugs have statistically significantly different prices?TABLE 12-20 Mean and Standard Deviation of Prices of Six HIV Drugs Drug Mean Price Standard Deviation in Price A $3,200 $856 $6,800 $925 $11,352 $754 $3,945 $920 $2,120 $645 $4,856 $540
Step by Step Solution
There are 3 Steps involved in it
1 Expert Approved Answer
Step: 1 Unlock

Question Has Been Solved by an Expert!
Get step-by-step solutions from verified subject matter experts
Step: 2 Unlock
Step: 3 Unlock