

Question: this is the question : https://www.bankofcanada.ca/rates/banking-and-financial-statistics/selected-monetary-aggregates-and-their-components-formerly-e1/ a) (9 points) Go to the website https://www.bankofcanada.ca/rates/banking-and-financial- statistics/selected-monetary-aggregates-and-theircomponents-formerly-e1/ and obtain MONTHLY data for the period January 1990 to
this is the question : https://www.bankofcanada.ca/rates/banking-and-financial-statistics/selected-monetary-aggregates-and-their-components-formerly-e1/
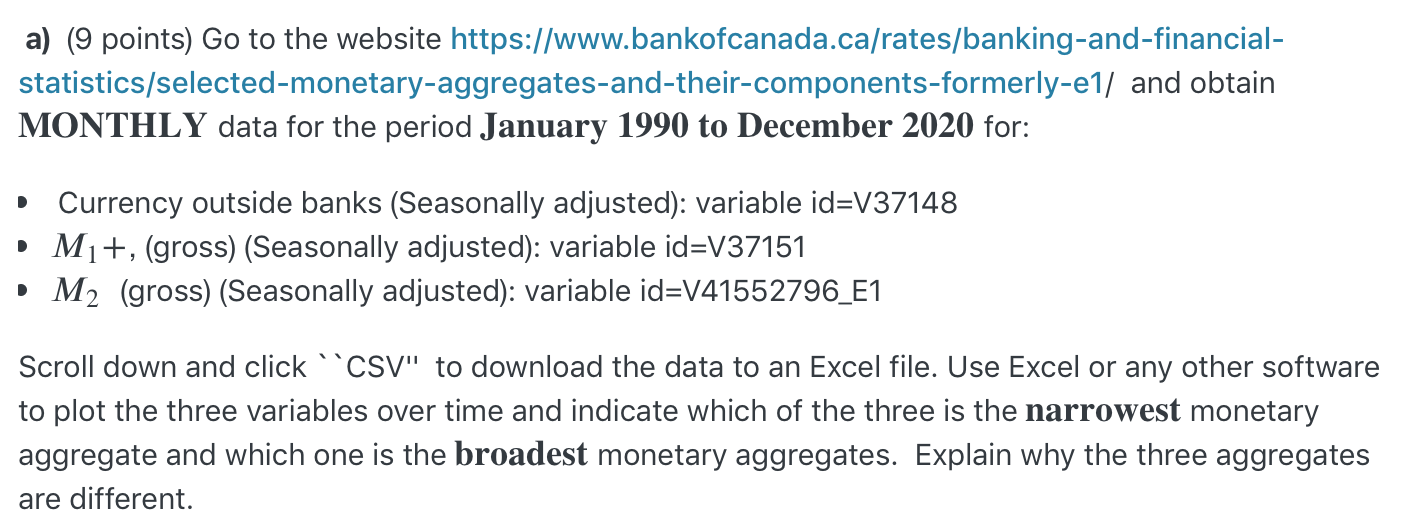
a) (9 points) Go to the website https://www.bankofcanada.ca/rates/banking-and-financial- statistics/selected-monetary-aggregates-and-theircomponents-formerly-e1/ and obtain MONTHLY data for the period January 1990 to December 2020 for: | Currency outside banks (Seasonally adjusted): variable id=V37'I48 I M1 +, (gross) (Seasonally adjusted): variable id=V37151 I M; (gross) (Seasonally adjusted): variable id=V41552796_E'| Scroll down and click ' 'CSV" to download the data to an Excel file. Use Excel or any other software to plot the three variables over time and indicate which of the three is the narrowest monetary aggregate and which one is the broadest monetary aggregates. Explain why the three aggregates are different
Step by Step Solution
There are 3 Steps involved in it

Get step-by-step solutions from verified subject matter experts