

Question: This is the question: Using the mean and standard deviation for the continuous data, identify the applicable values of X for the following: Identify the
This is the question:
Using the mean and standard deviation for the continuous data, identify the applicable values of X for the following: Identify the value of X of 20% of the data, identify the value of X for the top 10% of the data, and 95% of the data lies between two values of X.
I have to do this in excel and show formulas and use the data of the games 2019 & 2020 for all seven teams must use the binomial distribution. X= wins/losses for each team
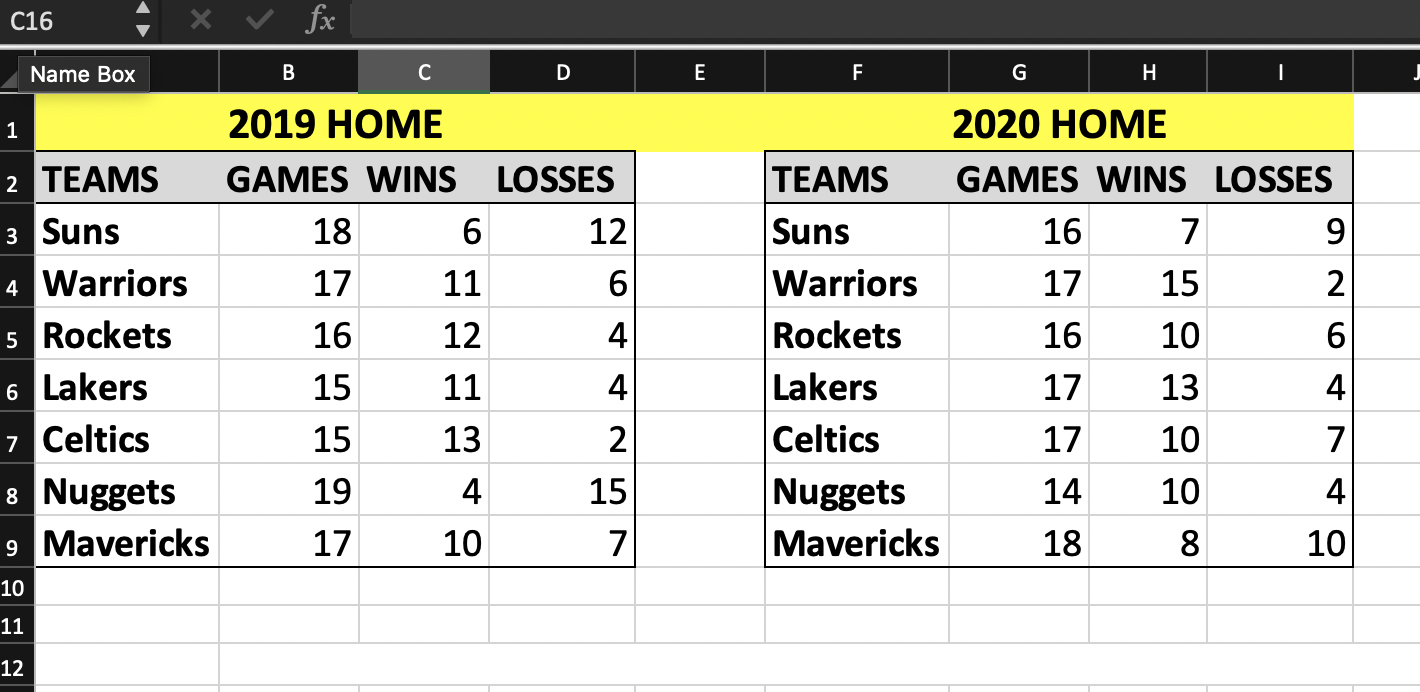
C16 fx Name Box B D E F G H 1 2019 HOME 2 TEAMS GAMES WINS LOSSES 3 Suns 18 6 12 4 Warriors 17 11 6 5 Rockets 16 12 4 6 Lakers 15 11 4. 7 Celtics 15 13 2 8 Nuggets 19 15 9 Mavericks 17 10 7 2020 HOME TEAMS GAMES WINS LOSSES Suns 16 7 9 Warriors 17 15 2 Rockets 16 10 6 Lakers 17 13 4 Celtics 17 10 7 Nuggets 14 10 4 Mavericks 18 8 10 2 4 10 11 12 C16 fx Name Box B D E F G H 1 2019 HOME 2 TEAMS GAMES WINS LOSSES 3 Suns 18 6 12 4 Warriors 17 11 6 5 Rockets 16 12 4 6 Lakers 15 11 4. 7 Celtics 15 13 2 8 Nuggets 19 15 9 Mavericks 17 10 7 2020 HOME TEAMS GAMES WINS LOSSES Suns 16 7 9 Warriors 17 15 2 Rockets 16 10 6 Lakers 17 13 4 Celtics 17 10 7 Nuggets 14 10 4 Mavericks 18 8 10 2 4 10 11 12
Step by Step Solution
There are 3 Steps involved in it

Get step-by-step solutions from verified subject matter experts