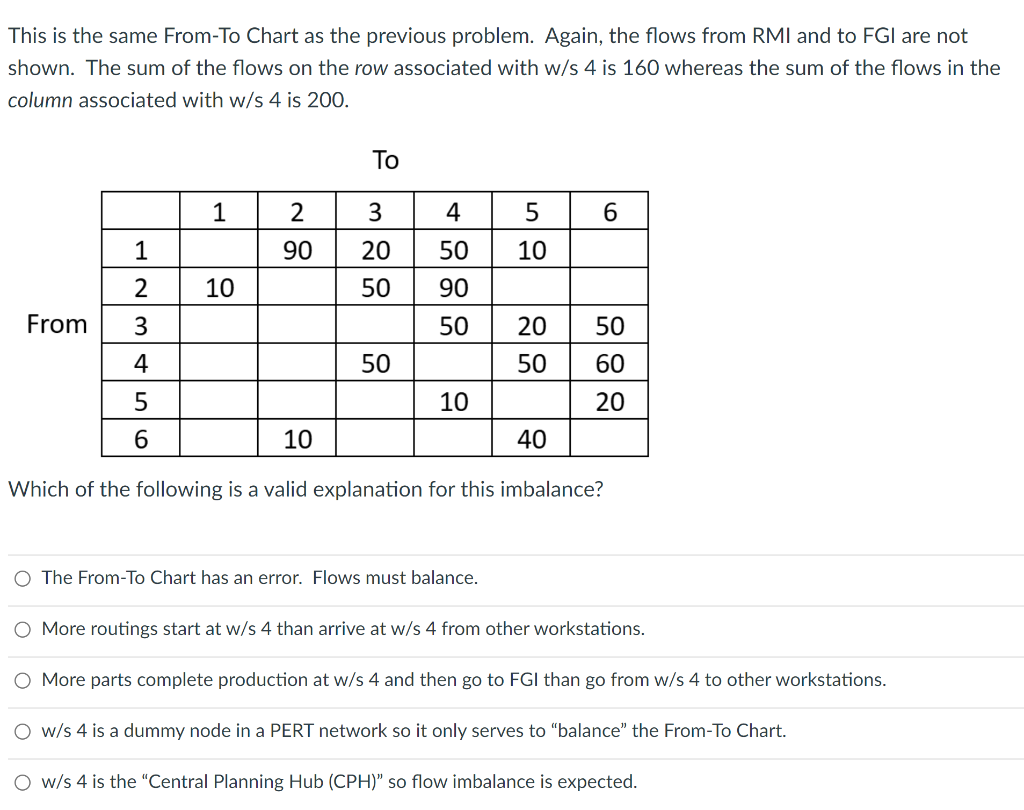
Question: This is the same From-To Chart as the previous problem. Again, the flows from RMI and to FGI are not shown. The sum of the

This is the same From-To Chart as the previous

This is the same From-To Chart as the previous problem. Again, the flows from RMI and to FGI are not shown. The sum of the flows on the row associated with w/s 4 is 160 whereas the sum of the flows in the column associated with w/s 4 is 200. To 1 2 3 4 5 6 90 20 10 50 90 10 50 From 50 20 50 OU AWNA 50 50 60 10 20 10 40 Which of the following is a valid explanation for this imbalance? The From-To Chart has an error. Flows must balance. O More routings start at w/s 4 than arrive at w/s 4 from other workstations. O More parts complete production at w/s 4 and then go to FGI than go from w/s 4 to other workstations. O w/s 4 is a dummy node in a PERT network so it only serves to "balance" the From-To Chart. O w/s 4 is the "Central Planning Hub (CPH)" so flow imbalance is expected

Step by Step Solution

There are 3 Steps involved in it

1 Expert Approved Answer
Step: 1 Unlock blur-text-image
Question Has Been Solved by an Expert!

Get step-by-step solutions from verified subject matter experts

Step: 2 Unlock
Step: 3 Unlock

Students Have Also Explored These Related General Management Questions!