Question: This is the second milestone leading up to your final project. In Final Project Milestone One, you introduced the business you chose. You examined its
This is the second milestone leading up to your final project. In Final Project Milestone One, you introduced the business you chose. You examined its financial statements and financial health and reported its financial values. In Final Project Milestone Two, you will make calculations based on the latest information found using Mergent Online about your company and compare the totals with those of one year ago. You will then use these figures to decide whether short-term financing is needed to improve your company's financial health. Before moving forward, review your instructor's feedback for Milestone One and incorporate any suggestions.
Scenario
The CFO of your company has asked for your support in preparing a report for the business's board of directors. Many of the board members are new, and some of them have little background in finance. With this in mind, you will need to write a report that all board members can easily understand.
Directions
For the company you chose for your final project, open the following documents:
The balance sheet, income statement, and cash flow statement from the latest fiscal quarter (from Mergent Online)
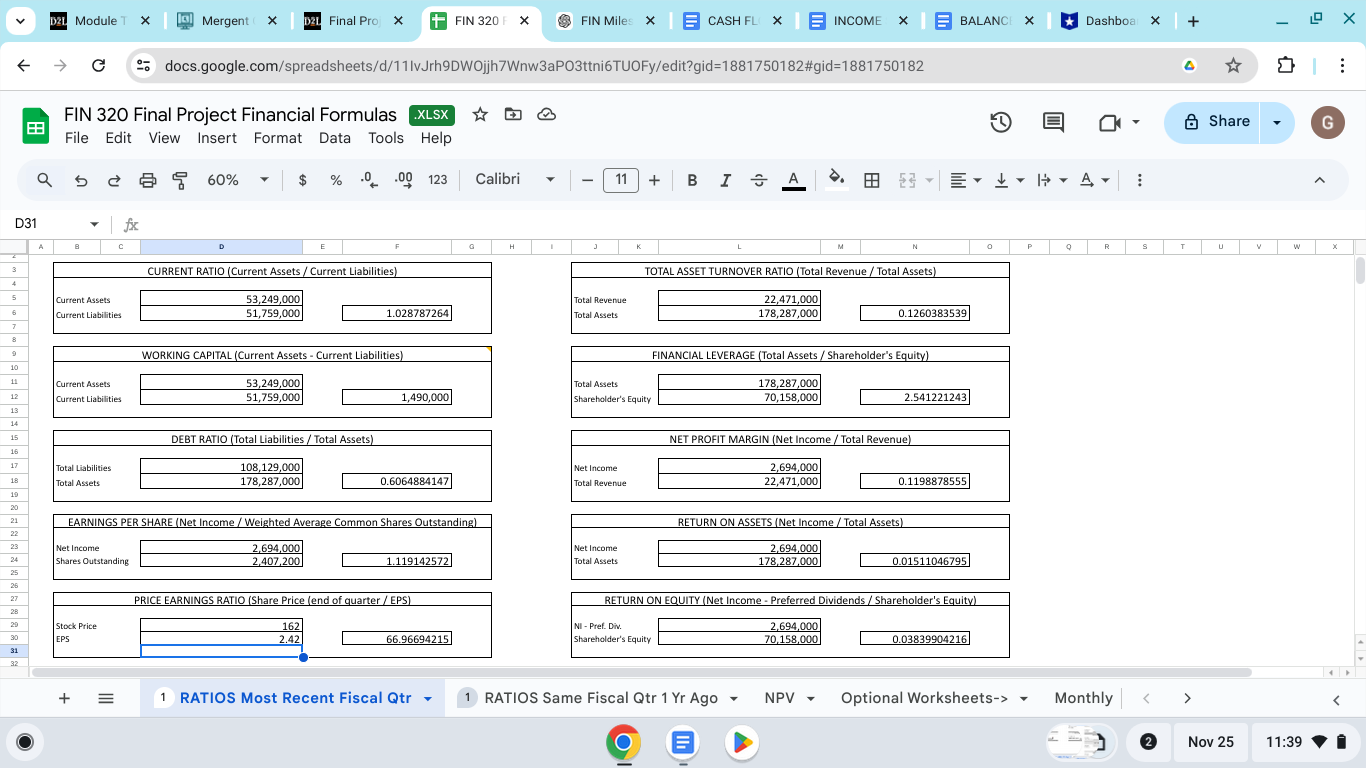
The Ratios Most Recent Fiscal Qtr worksheet in the Final Project Financial Formulas workbook (linked in the What to Submit section).
example, if the latest fiscal quarter available is the third quarter in 2023, you'll compare those results to the same financial calculations from the third quarter in 2022.
Use the documents to calculate key financial ratios.
Then open the following documents:
The balance sheet, income statement, and cash flow statement from the same fiscal quarter one year ago
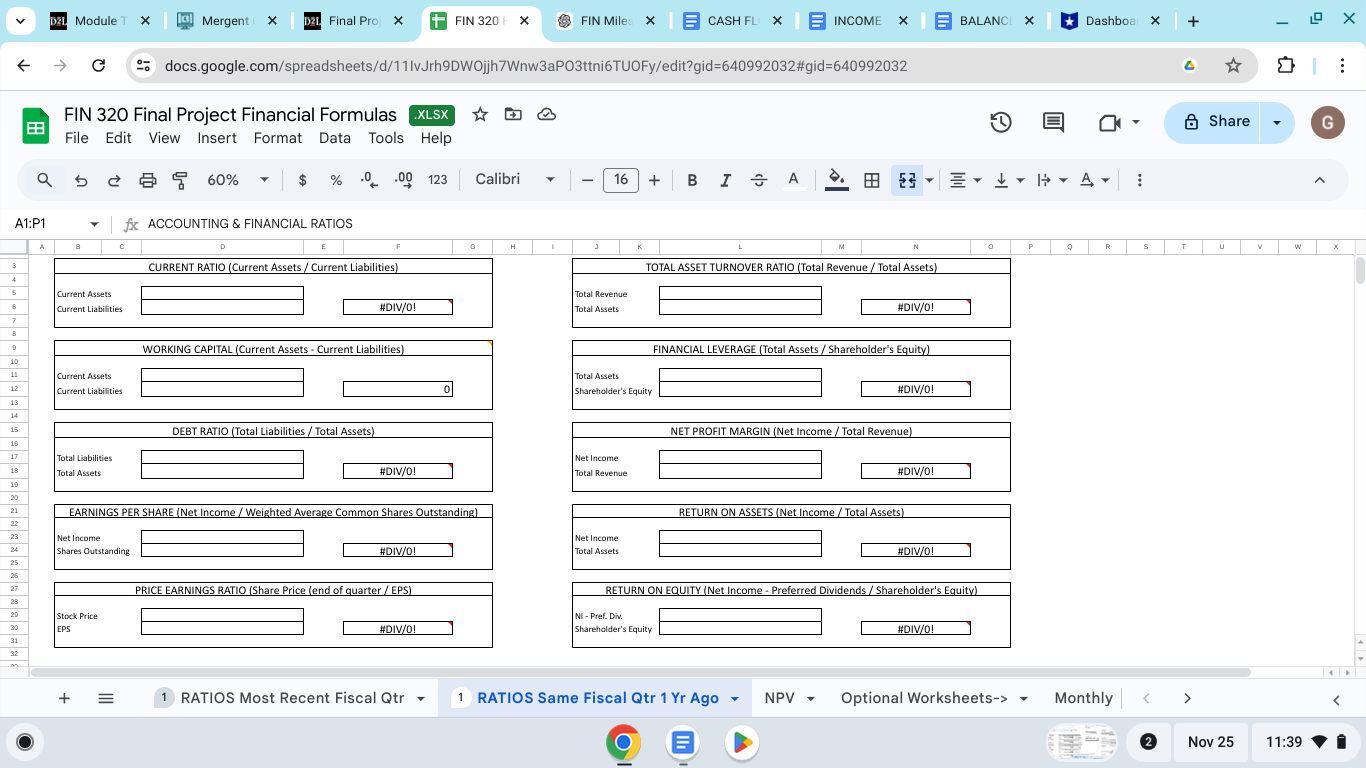
The Ratios Same Fiscal Qtr 1 Year Ago worksheet
Use the documents to calculate the same financial ratios. Finally, compare those ratios and analyze your results.
Specifically, you must address the following rubric criteria:
Financial Calculations. Calculate accurate financial formulas to assess the business's current financial health. Specifically, calculate the following formulas using the Ratios Most Recent Fiscal Qtr and the Ratios Same Fiscal Qtr 1 Year Ago worksheets in the Final Project Financial Formulas workbook:
Working capital
Current ratio
Debt ratio
Earnings per share
Price and earnings ratio
Total asset turnover ratio
Financial leverage
Net profit margin
Return on assets
Return on equity
Fiscal Quarter Comparison. Summarize the differences between the following:
The results from your financial calculations of the most recent fiscal quarter
The results of the same financial calculations of the same fiscal quarter from one year ago
For example, if the most recent fiscal quarter available is the third quarter in 2023, you'll compare those results to the same financial calculations from the third quarter in 2022.
Comparison Analysis. Explain what your calculations and comparison show about the business's current financial health. Give examples to support your explanation for the following questions:
Do the results show the business is financially healthy or unhealthy? Which results indicate this?
What might be the causes of the business's financial success or failure?
Is more information needed to determine the business's financial health? If so, which pieces of information might still be needed?
Short-Term Financing. Explain how potential short-term financing sources could help the business raise funds needed to improve its financial health. Base your response on the business's current financial information.
D21 Module T x | [ol Mergent ( X | 12L Final Proj X + FIN 320 F X $FIN Miles X | E CASH FL( X | E INCOME * | E BALANCE X | Dashboa X + X -) G 2 docs.google.com/spreadsheets/d/11lvJrh9DWOjjh7Wnw3aPO3ttni6TUOFy/edit?gid=1881750182#gid=1881750182 4 FIN 320 Final Project Financial Formulas .XLSX EE & Share G File Edit View Insert Format Data Tools Help Q 5 2 8 5 60% $ % .0 .00 123 Calibri 11 + B I A D31 fx B C E G H J K 0 P R S T U v w X CURRENT RATIO (Current Assets / Current Liabilities) TOTAL ASSET TURNOVER RATIO (Total Revenue / Total Assets] Current Assets 53,249,000 Total Revenue 22,471,000 Current Liabilities 51,759,000 1.028787264 Total Assets 178,287,000 0.1260383539 WORKING CAPITAL (Current Assets - Current Liabilities) FINANCIAL LEVERAGE (Total Assets / Shareholder's Equity) Current Assets 53,249,000 Total Assets 178,287,000 Current Liabilities $1,759,000 1,490,000 Shareholder's Equity 70,158,000 2.541221243 DEBT RATIO (Total Liabilities / Total Assets NET PROFIT MARGIN (Net Income / Total Revenue) Total Liabilities 108,129,000 Net Income 2,694,000 Total Assets 178,287,000 0.6064884147 Total Revenue 22,471,000 0.1198878555 EARNINGS PER SHARE (Net Income / Weighted Average Common Shares Outstanding) RETURN ON ASSETS (Net Income / Total Assets) Net Income 2,694,000 Net Income 2,694,000 Shares Outstanding 2,407,200 1.119142572 Total Assets 178,287,000 0.01511046795 PRICE EARNINGS RATIO (Share Price (end of quarter / EPS) RETURN ON EQUITY (Net Income - Preferred Dividends / Shareholder's Equity) Stock Price 162 NI - Pref. Div. 2,694,000 EPS 2.42 66.96694215 Shareholder's Equity 70.158,000 0.03839904216 31 + = 1 RATIOS Most Recent Fiscal Qtr - 1 RATIOS Same Fiscal Qtr 1 Yr Ago NPV Optional Worksheets-> > Monthly E E 2 Nov 25 11:39D21 Module T x | [ol Mergent ( X | 12L Final Proj X + FIN 320 F X $FIN Miles X | E CASH FL( X | E INCOME x | E BALANCE X | |Dashboa X + X -) G 2 docs.google.com/spreadsheets/d/11lvJrh9DWOjh7Wnw3aPO3ttni6TUOFy/edit?gid=640992032#gid=640992032 4 FIN 320 Final Project Financial Formulas .XLSX EE & Share G File Edit View Insert Format Data Tools Help Q 5 2 8 5 60% $ % .0 .00 123 Calibri Y 16 + B I A A1:P1 fx ACCOUNTING & FINANCIAL RATIOS B C G K 0 P Q R S T U v w X CURRENT RATIO (Current Assets / Current Liabilities) TOTAL ASSET TURNOVER RATIO (Total Revenue / Total Assets) Current Assets Total Revenue Current Liabilities #DIV/O! Total Assets #DIV/O! WORKING CAPITAL (Current Assets - Current Liabilities] FINANCIAL LEVERAGE (Total Assets / Shareholder's Equity) Current Assets Total Assets Current Liabilities 0 Shareholder's Equity #DIV/O! DEBT RATIO (Total Liabilities / Total Assets) NET PROFIT MARGIN (Net Income / Total Revenue) Total Liabilities Net Income Total Assets #DIV/O! Total Revenue #DIV/O! EARNINGS PER SHARE (Net Income / Weighted Average Common Shares Outstanding) RETURN ON ASSETS (Net Income / Total Assets] Net Income Net Income Shares Outstanding #DIV/O! Total Assets #DIV/O! PRICE EARNINGS RATIO (Share Price (end of quarter / EPS) RETURN ON EQUITY (Net Income - Preferred Dividends / Shareholder's Equity) Stock Price NI - Pref. Div. EPS #DIV/O! Shareholder's Equity #DIV/O! 32 + E 1 RATIOS Most Recent Fiscal Qtr 1 RATIOS Same Fiscal Qtr 1 Yr Ago NPV * Optional Worksheets-> > Monthly E 2 Nov 25 11:39D21 Module T x | [ol Mergent ( X | 12L Final Proj X + FIN 320 F X $FIN Miles X | E CASH FL( X | E INCOME x | E BALANCE X | Dashboa X + X -) G 2 docs.google.com/spreadsheets/d/11lvJrh9DWOjh7Wnw3aPO3ttni6TUOFy/edit?gid=1511199625#gid=1511199625 4 FIN 320 Final Project Financial Formulas .XLSX EE & Share G File Edit View Insert Format Data Tools Help Q 5 2 8 5 60% Y $ % .0 .00 123 Calibri 16 + B I A A1:R1 fx Net Present Value (NPV) Calculator D F G L M N P Q R S T U V w X Y Z Net Present Value (NPV) Calculator Building Initial Investment Year 5 Cash Flows SO So SO SO 5 SO 6 8 9 10 Annual Cash Inflows SO SO SO SO Discount Rate NPV = SO Year 11 12 so so 14 16 18 19 20 Number of Years Cash Flows so So SO SO Salvage Value 10 14 12 Equipment 13 14 Initial Investment Year 15 4 5 8 9 10 Annual Cash Inflows Cash Flows So So SO So SO 16 Discount Rate NPV = SO Year 11 18 19 20 17 Number of Years Cash Flows so so SO SO SO SO So SD 18 Salvage Value 19 20 21 22 Bonds 23 24 Initial Investment 25 Annual Cash Inflows 26 Discount Rate NPV = | SO Year 27 Number of Years Cash Flows 28 Principal Returned 20 + OS Most Recent Fiscal Qtr . 1 RATIOS Same Fiscal Qtr 1 Yr Ago NPV - Optional Worksheets-> > Monthly . Annual 2 Nov 25 11:39
Step by Step Solution
There are 3 Steps involved in it
1 Expert Approved Answer
Step: 1 Unlock
Question Has Been Solved by an Expert!
Get step-by-step solutions from verified subject matter experts
Step: 2 Unlock
Step: 3 Unlock
Students Have Also Explored These Related Finance Questions!