

Question: THIS IS THE TABLE IN PROBLEM 2 5) Using the table created in Problem #2 above, plot the opportunity set of risky assets in Excel.
THIS IS THE TABLE IN PROBLEM 2
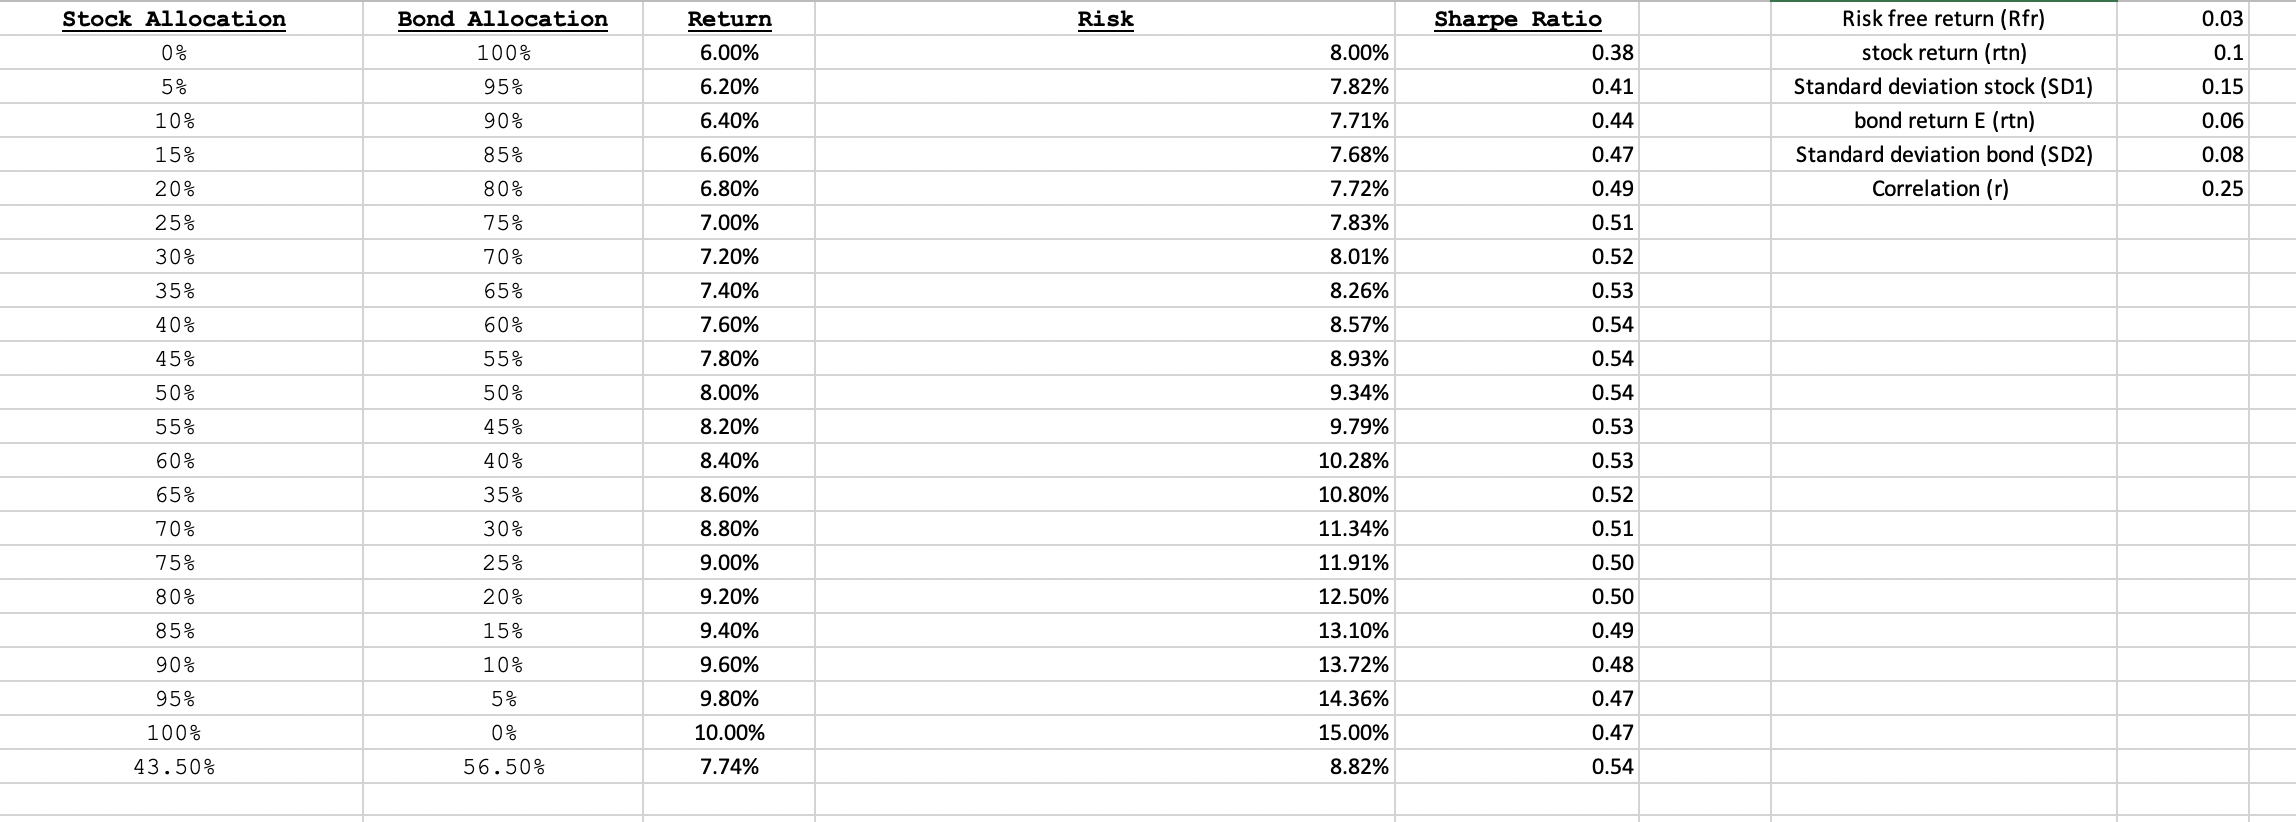 5) Using the table created in Problem #2 above, plot the opportunity set of risky assets in Excel.
Then vary the correlation between stocks and bonds from + 1 to -1 and describe the changes in shape of the efficient frontier as you do so.
Upload the Excel file that contains the table & graph.
Also include in Excel file a description of the efficient frontier's shape as you vary the correlation. (10 pts)
6) Using the graph of the opportunity set of risky assets created in Problem #5, answer the following:
a) Change the correlation of stocks and bonds back to 0.25 and observe the shape of the efficient frontier.
Starting at the point that corresponds to 100% Bonds & 0% Stocks, describe what happens to portfolio risk and return as you increase the stock allocation and decrease the bond allocation? Why is this happening? (10 pts)
| Stock Allocation | Bond Allocation | Return | Risk | Sharpe Ratio |
| 0% | 100% | 6.00% | 8.00% | 0.38 |
| 5% | 95% | 6.20% | 7.82% | 0.41 |
| 10% | 90% | 6.40% | 7.71% | 0.44 |
| 15% | 85% | 6.60% | 7.68% | 0.47 |
| 20% | 80% | 6.80% | 7.72% | 0.49 |
| 25% | 75% | 7.00% | 7.83% | 0.51 |
| 30% | 70% | 7.20% | 8.01% | 0.52 |
| 35% | 65% | 7.40% | 8.26% | 0.53 |
| 40% | 60% | 7.60% | 8.57% | 0.54 |
| 45% | 55% | 7.80% | 8.93% | 0.54 |
| 50% | 50% | 8.00% | 9.34% | 0.54 |
| 55% | 45% | 8.20% | 9.79% | 0.53 |
| 60% | 40% | 8.40% | 10.28% | 0.53 |
| 65% | 35% | 8.60% | 10.80% | 0.52 |
| 70% | 30% | 8.80% | 11.34% | 0.51 |
| 75% | 25% | 9.00% | 11.91% | 0.50 |
| 80% | 20% | 9.20% | 12.50% | 0.50 |
| 85% | 15% | 9.40% | 13.10% | 0.49 |
| 90% | 10% | 9.60% | 13.72% | 0.48 |
| 95% | 5% | 9.80% | 14.36% | 0.47 |
| 100% | 0% | 10.00% | 15.00% | 0.47 |
| 43.50% | 56.50% | 7.74% | 8.82% | 0.54 |
Bond Allocation Risk 0.03 Stock Allocation 0% Sharpe Ratio 0.38 100% 0.1 5% Return 6.00% 6.20% 6.40% 6.60% 0.15 95% 90% 85% 0.41 0.44 10% Risk free return (Rfr) stock return (rtn) Standard deviation stock (SD1) bond return E (tn) Standard deviation bond (SD2) Correlation (r) 8.00% 7.82% 7.71% 7.68% 7.72% 7.83% 8.01% 0.06 0.08 15% 0.47 20% 0.49 0.25 80% 75% 25% 0.51 70% 0.52 30% 35% 6.80% 7.00% 7.20% 7.40% 7.60% 7.80% 0.53 65% 60% 8.26% 8.57% 40% 0.54 0.54 45% 55% 50% 50% 8.00% 8.20% 8.93% 9.34% 9.79% 10.28% 0.54 0.53 55% 45% 60% 8.40% 0.53 40% 35% 65% 10.80% 0.52 30% 0.51 70% 75% 25% 20% 8.60% 8.80% 9.00% 9.20% 9.40% 80% 85% 11.34% 11.91% 12.50% 13.10% 13.72% 0.50 0.50 0.49 15% 90% 10% 9.60% 0.48 95% 5% 0.47 14.36% 15.00% 100% 9.80% 10.00% 7.74% 0.47 0% 56.50% 43.50% 8.82% 0.54 Bond Allocation Risk 0.03 Stock Allocation 0% Sharpe Ratio 0.38 100% 0.1 5% Return 6.00% 6.20% 6.40% 6.60% 0.15 95% 90% 85% 0.41 0.44 10% Risk free return (Rfr) stock return (rtn) Standard deviation stock (SD1) bond return E (tn) Standard deviation bond (SD2) Correlation (r) 8.00% 7.82% 7.71% 7.68% 7.72% 7.83% 8.01% 0.06 0.08 15% 0.47 20% 0.49 0.25 80% 75% 25% 0.51 70% 0.52 30% 35% 6.80% 7.00% 7.20% 7.40% 7.60% 7.80% 0.53 65% 60% 8.26% 8.57% 40% 0.54 0.54 45% 55% 50% 50% 8.00% 8.20% 8.93% 9.34% 9.79% 10.28% 0.54 0.53 55% 45% 60% 8.40% 0.53 40% 35% 65% 10.80% 0.52 30% 0.51 70% 75% 25% 20% 8.60% 8.80% 9.00% 9.20% 9.40% 80% 85% 11.34% 11.91% 12.50% 13.10% 13.72% 0.50 0.50 0.49 15% 90% 10% 9.60% 0.48 95% 5% 0.47 14.36% 15.00% 100% 9.80% 10.00% 7.74% 0.47 0% 56.50% 43.50% 8.82% 0.54
Step by Step Solution
There are 3 Steps involved in it

Get step-by-step solutions from verified subject matter experts