

Question: This is written and solved ONLY using rStudio. But if you have an easier way to do it, that works: Information related to questions: For
This is written and solved ONLY using rStudio. But if you have an easier way to do it, that works:
Information related to questions:
For this exercise, we are going to look at salaries for college teachers and how they relate to age, gender, and highest degree completed. We have access to a random sample of college teachers taken from the 2010 American Community Survey (ACS) 1-year Public Use Microdata Sample (PUMS). The file salary_gender.csv (at the bottom of the page) contains 100 observations on the following 4 variables.
- Salary: Annual salary in $1,000's
- Gender: 0=female or 1=male
- Age: Age in years
- PhD: 1=have PhD or 0=no PhD
Read in the associated data file and convert Gender and PhD to be factors.
Load packages
library(tidyverse) library(broom) library(car)
Question 9 (2 pts)
Begin by fitting a linear model that uses Salary as the response variable and Age, Gender, PhD, and all associated two-term interactions as predictor variables. Plot the diagnostic 4-pack to assess the model conditions.
Based on the plot of residuals versus fitted values (1st plot in the 4-pack), what best describes the pattern of residual variance associated with this model:
Group of answer choices
a. The variance of the residuals is the same for all fitted values
b. The variance of the residuals increases as fitted values increase
c. The variance of the residuals decreases as fitted values increase
d. There is no variability in the residuals
Question 10 (2 pts)
When model conditions fall short, we have found that the use of transformations can help to correct these short-comings. The boxCox function from the car package (Companion for Applied Regression) is one of many tools that may be used to help find a suitable transformation for the response variable in a linear model. To use this function, simply type boxCox(my.model) where my.model is a linear model object. The results will be a plot of possible power transformations (lambda) on the x-axis and corresponding log-likelihood values on the y-axis. The idea of the Box-Cox method is to select a value of that maximizes the log-likelihood. Vertical dashed lines on the plot highlight a window of plausible values.
Apply the boxCox function to the model that you fit for question 8. What transformation for Salary is suggested by the Box-Cox method?
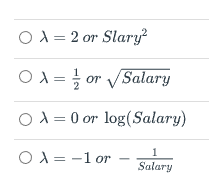
O X = 2 or Slary Salary O A = 0 or log( Salary) 1 O X = -1 or Salary
Step by Step Solution
There are 3 Steps involved in it

Get step-by-step solutions from verified subject matter experts