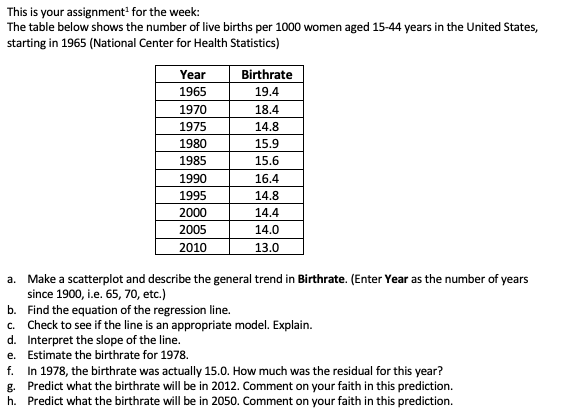
Question: This is your assignment for the week: The table below shows the number of live births per 1000 women aged 15-44 years in the United

This is your assignment for the week: The table

This is your assignment for the week: The table below shows the number of live births per 1000 women aged 15-44 years in the United States, starting in 1965 (National Center for Health Statistics) Year 1965 1970 1975 1980 1985 1990 1995 2000 2005 Birthrate 19.4 18.4 14.8 15.9 15.6 16.4 14.8 14.4 14.0 13.0 2010 a. Make a scatterplot and describe the general trend in Birthrate. (Enter Year as the number of years since 1900, i.e. 65, 70, etc.) b. Find the equation of the regression line. c. Check to see if the line is an appropriate model. Explain. d. Interpret the slope of the line. e. Estimate the birthrate for 1978. f. In 1978, the birthrate was actually 15.0. How much was the residual for this year? g. Predict what the birthrate will be in 2012. Comment on your faith in this prediction. h. Predict what the birthrate will be in 2050. Comment on your faith in this prediction

Step by Step Solution

There are 3 Steps involved in it

1 Expert Approved Answer
Step: 1 Unlock blur-text-image
Question Has Been Solved by an Expert!

Get step-by-step solutions from verified subject matter experts

Step: 2 Unlock
Step: 3 Unlock

Students Have Also Explored These Related General Management Questions!