

Question: This is your experimental data for Experiment #3, Determination of Copper in an Ore Sample. YOU MUST READ THE EXPERIMENTAL WRITE-UP AND COMPLETE THE PRE-LAB
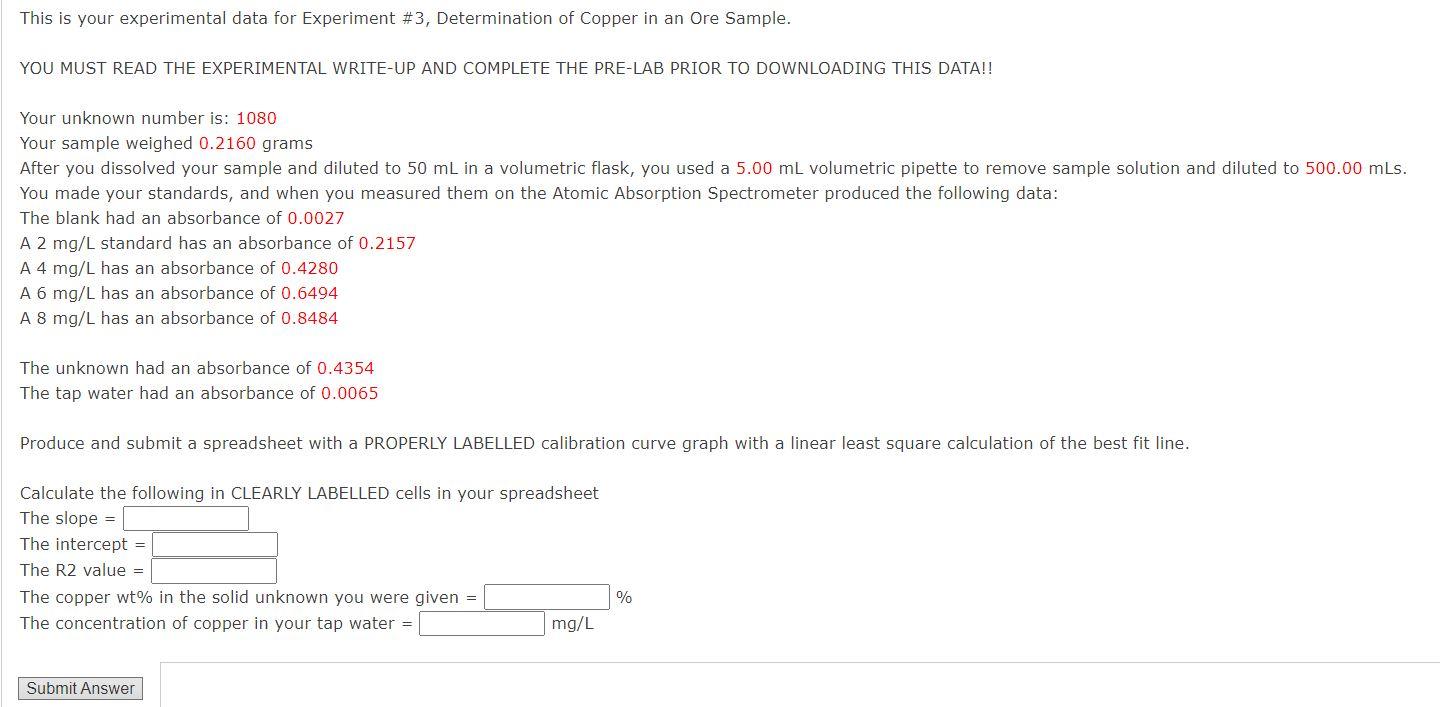
This is your experimental data for Experiment \#3, Determination of Copper in an Ore Sample. YOU MUST READ THE EXPERIMENTAL WRITE-UP AND COMPLETE THE PRE-LAB PRIOR TO DOWNLOADING THIS DATA!! Your unknown number is: 1080 Your sample weighed 0.2160 grams After you dissolved your sample and diluted to 50mL in a volumetric flask, you used a 5.00mL volumetric pipette to remove sample solution and diluted to 500.00mLs. You made your standards, and when you measured them on the Atomic Absorption Spectrometer produced the following data: The blank had an absorbance of 0.0027 A 2mg/L standard has an absorbance of 0.2157 A 4mg/L has an absorbance of 0.4280 A 6mg/L has an absorbance of 0.6494 A 8mg/L has an absorbance of 0.8484 The unknown had an absorbance of 0.4354 The tap water had an absorbance of 0.0065 Produce and submit a spreadsheet with a PROPERLY LABELLED calibration curve graph with a linear least square calculation of the best fit line. Calculate the following in CLEARLY LABELLED cells in your spreadsheet The slope = The intercept = The R2 value = The copper wt % in the solid unknown you were given = The concentration of copper in your tap water =
Step by Step Solution
There are 3 Steps involved in it

Get step-by-step solutions from verified subject matter experts