

Question: This md hasin please solve this question .. T-Mobile LTE 3:17 AM 6) 4 78706er G) bbhosted.cuny.edu 1. Which one of the following charts represents
This md hasin please solve this question
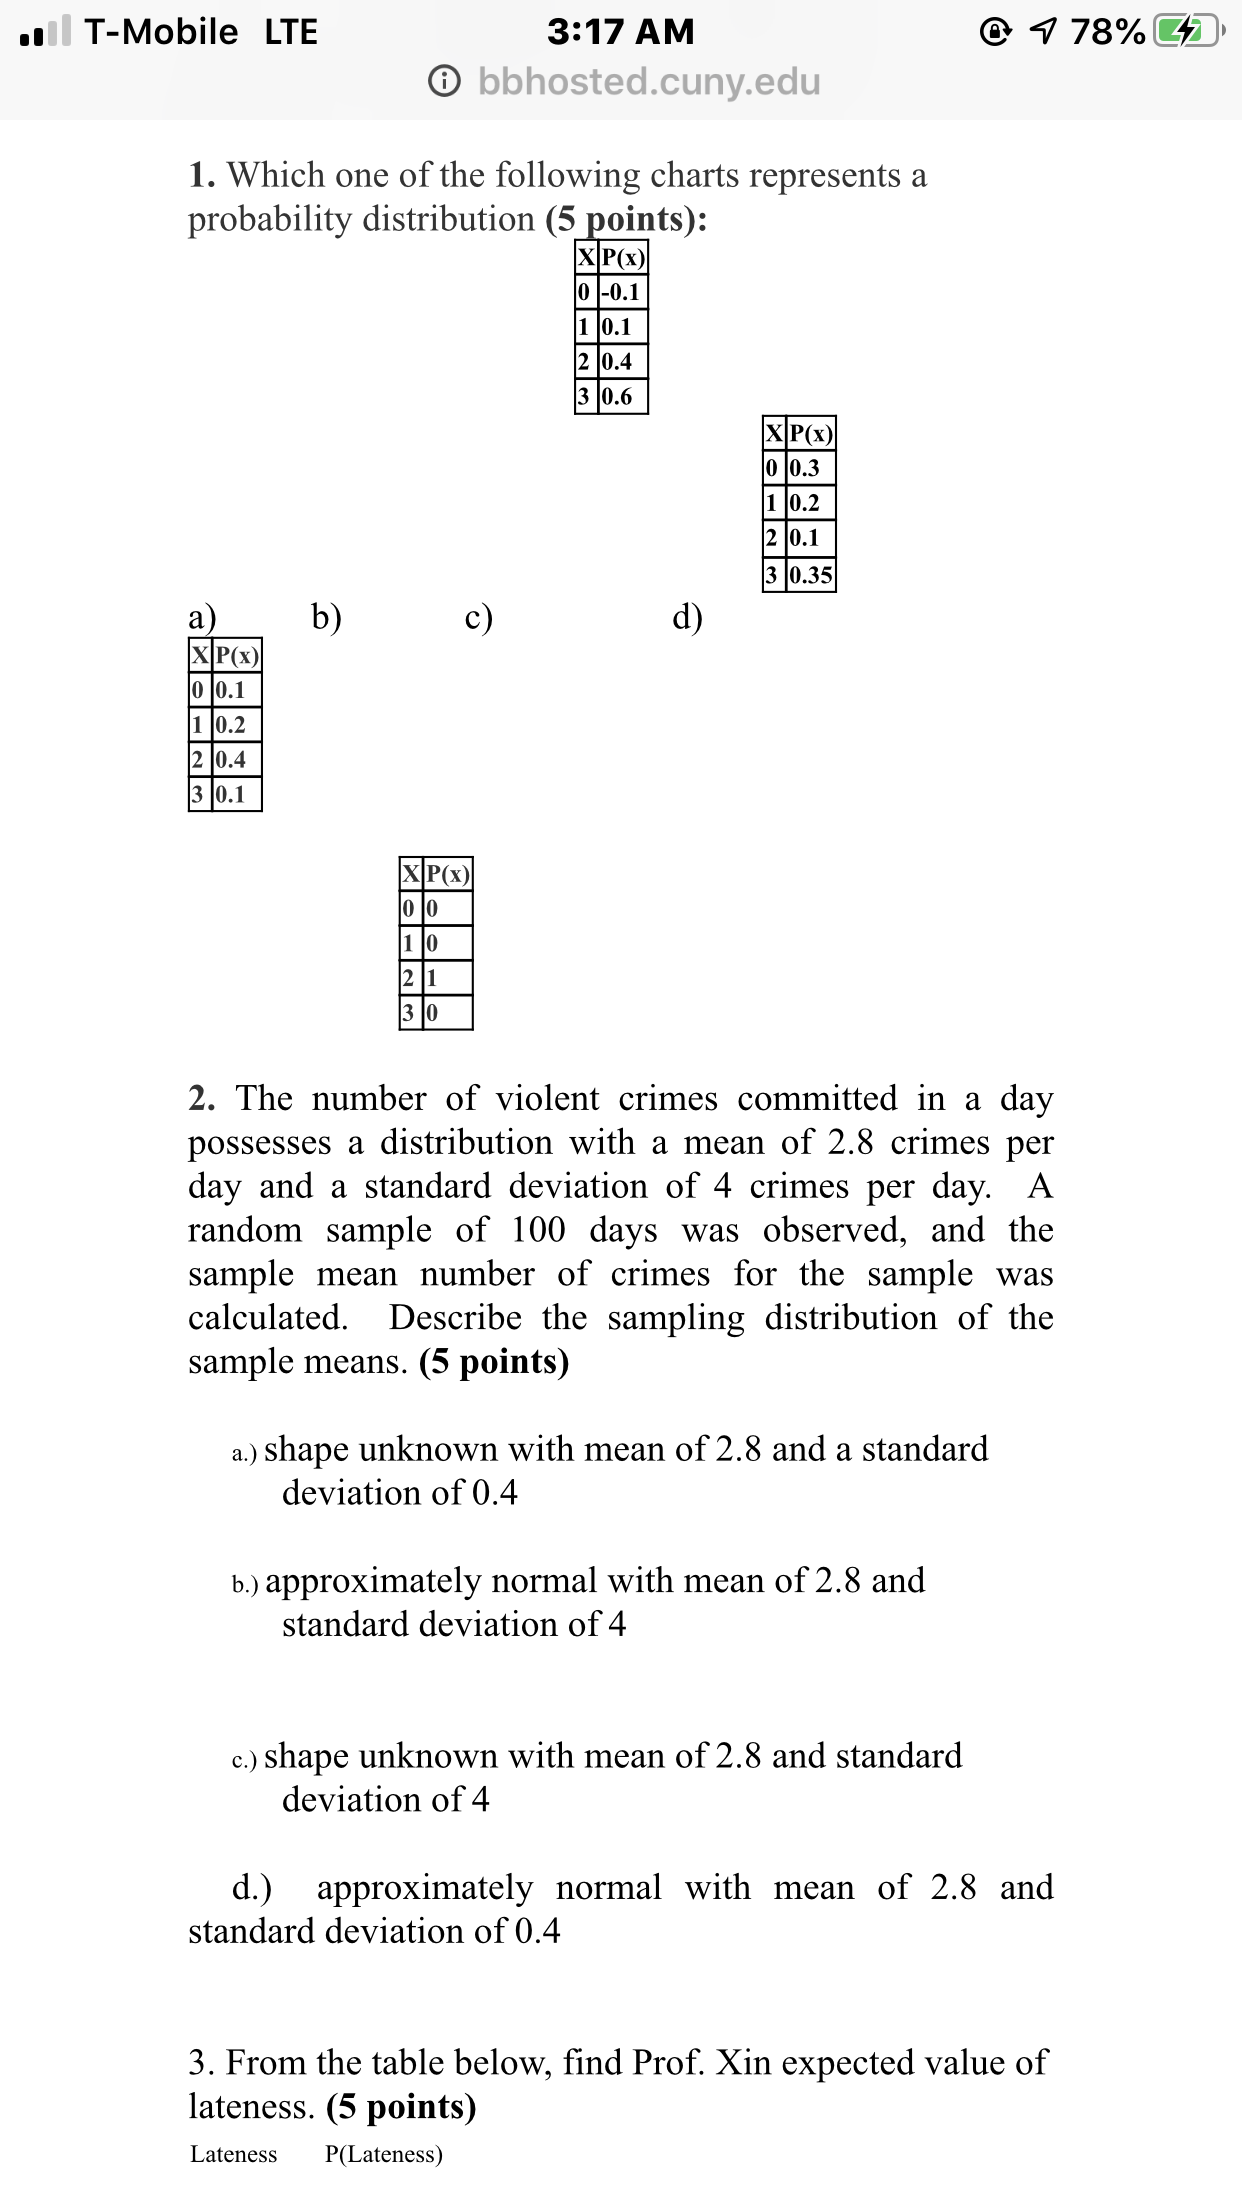
.. T-Mobile LTE 3:17 AM 6) 4 78706er G) bbhosted.cuny.edu 1. Which one of the following charts represents a probability distribution (5 noints): 2. The number of violent crimes committed in a day possesses a distribution with a mean of 2.8 crimes per day and a standard deviation of 4 crimes per day. A random sample of 100 days was observed, and the sample mean number of crimes for the sample was calculated. Describe the sampling distribution of the sample means. (5 points) a.) shape unknown with mean of 2.8 and a standard deviation of 0.4 b.) approximately normal with mean of 2.8 and standard deviation of 4 c.) shape unknown with mean of 2.8 and standard deviation of 4 d.) approximately normal with mean of 2.8 and standard deviation of 0.4 3. From the table below, nd Prof. Xin expected value of lateness. (5 points) Lateness P(Lateness)
Step by Step Solution
There are 3 Steps involved in it

Get step-by-step solutions from verified subject matter experts